 TrainNotes
Rep range distribution
What rep counts did you actually train?
What it shows
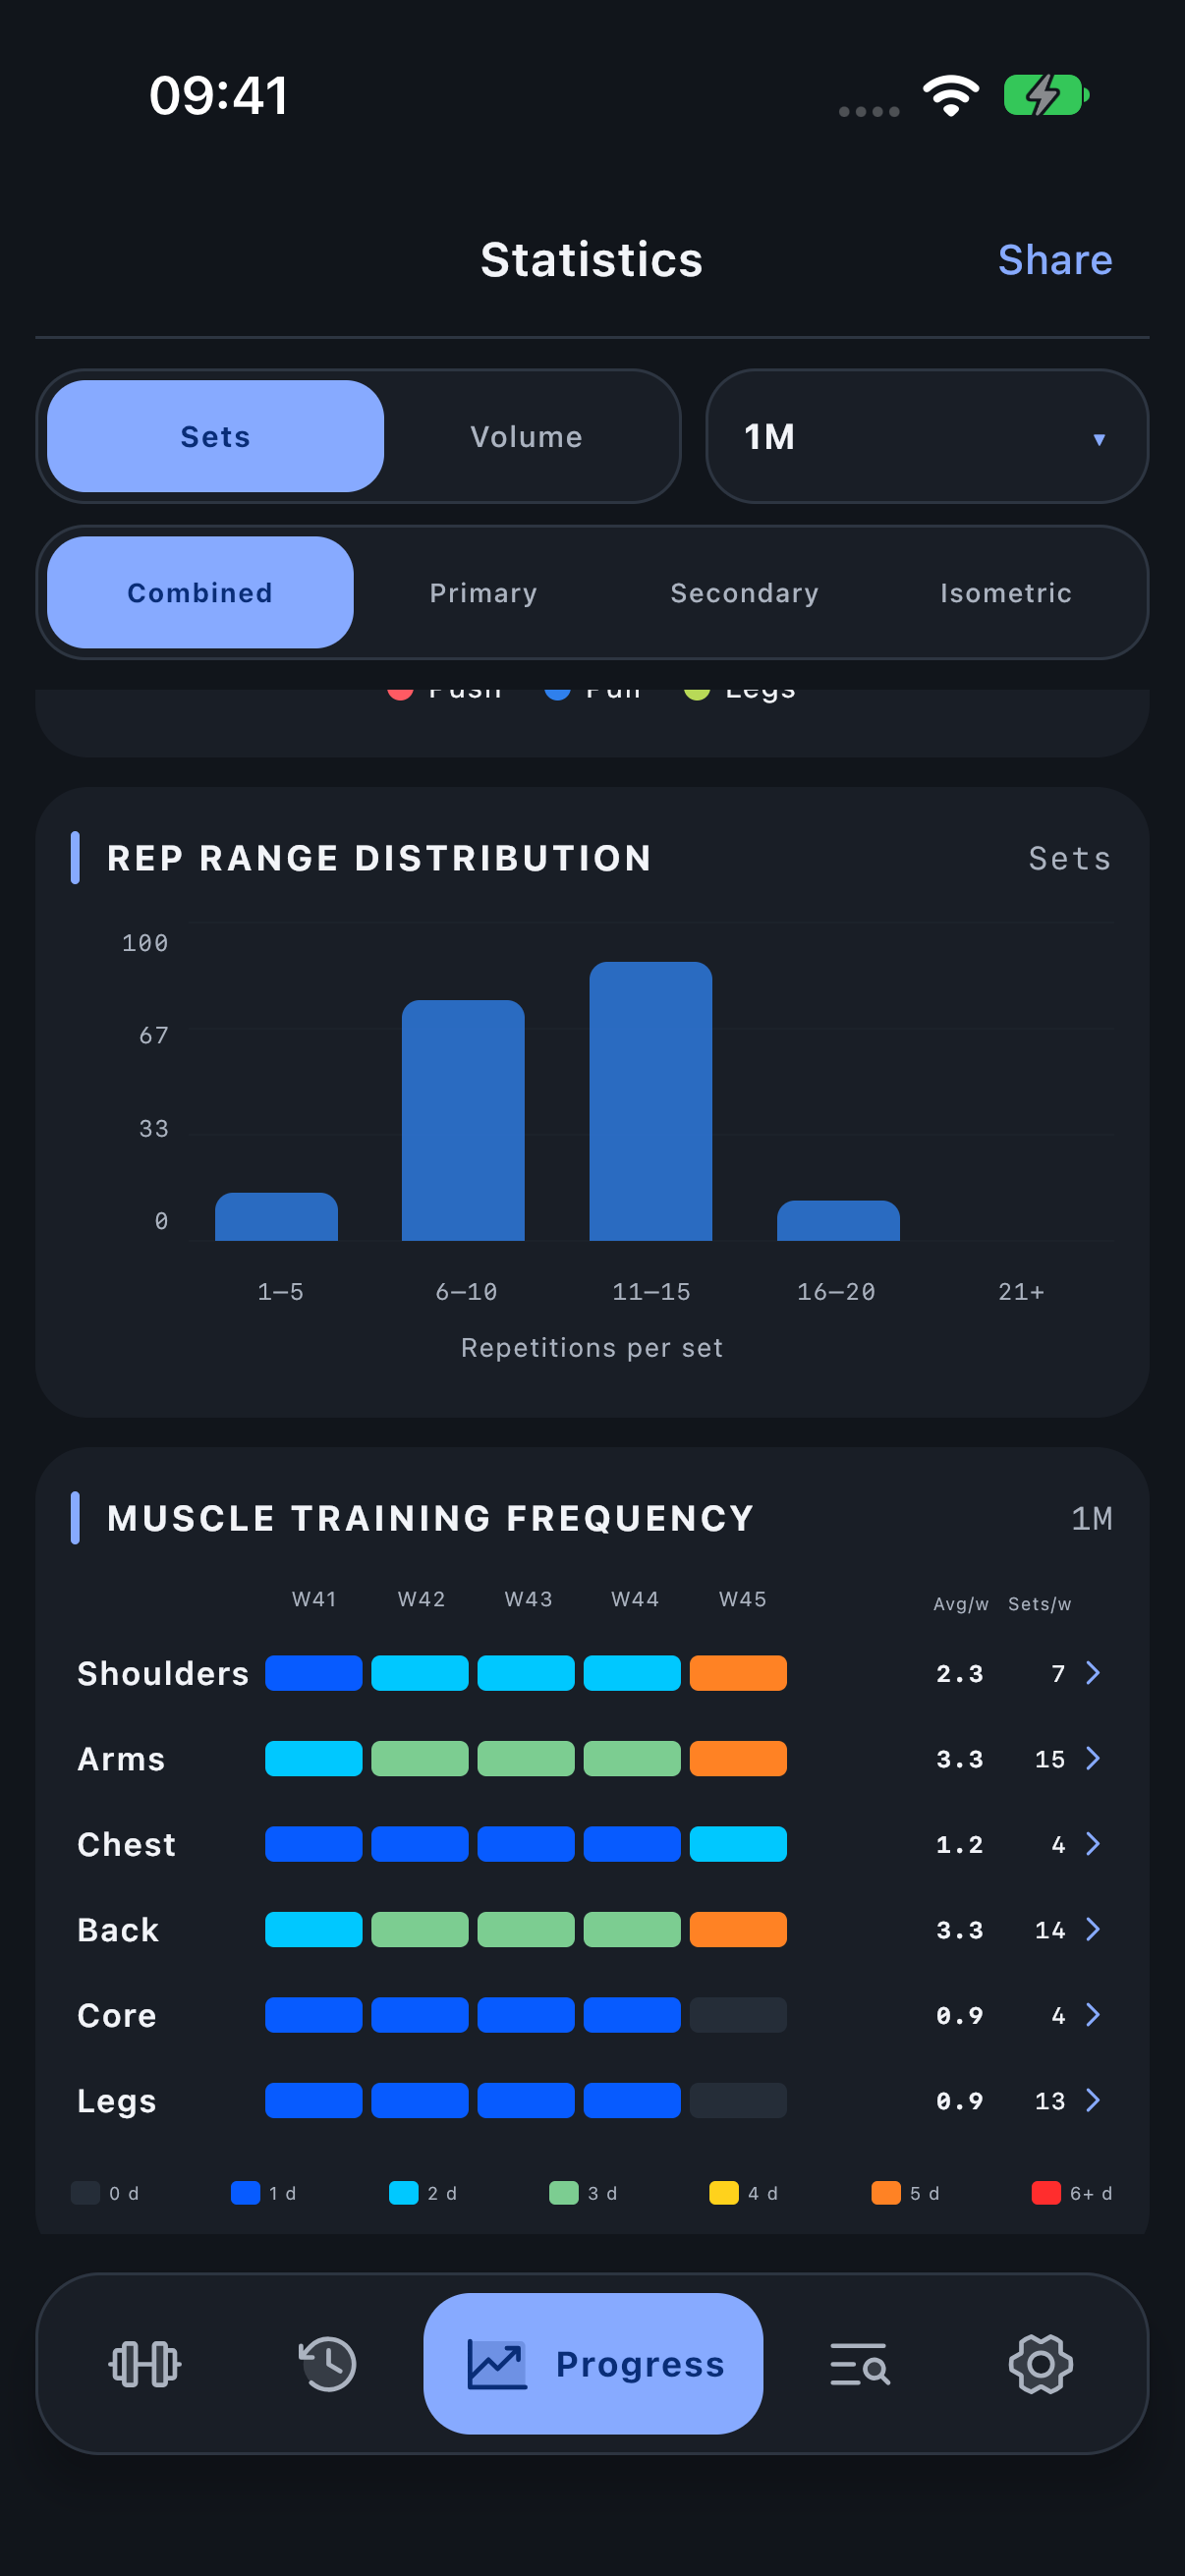
The histogram groups completed working sets by their successful actual reps: 1–5, 6–10, 11–15, 16–20 and 21+. These are observed results, not the target ranges written in your template.
How to read it
Read each bucket label and the selected metric. Tap a bar to inspect its value. Zero-height bars indicate no qualifying contribution in that bucket, not a missing rep target.
A set planned for 8–12 reps but completed at 7 belongs in 6–10. A 15-rep result belongs in 11–15. The planned range remains a separate target used during logging.
Period, units and filters
Sets adds working-set contribution in each bucket with the selected role weights; Volume adds effective load × reps with the same weighting. Warm-ups are excluded. Timed work without a rep count does not become a rep-range bar.
Investigate the result
Compare the histogram with your intended template ranges, then inspect the actual sessions if the distribution differs from your plan.
Open Progress → Statistics and scroll to the named module.