 TrainNotes
Exercise type trend
Did the amount of Compound or Isolation work change?
What it shows
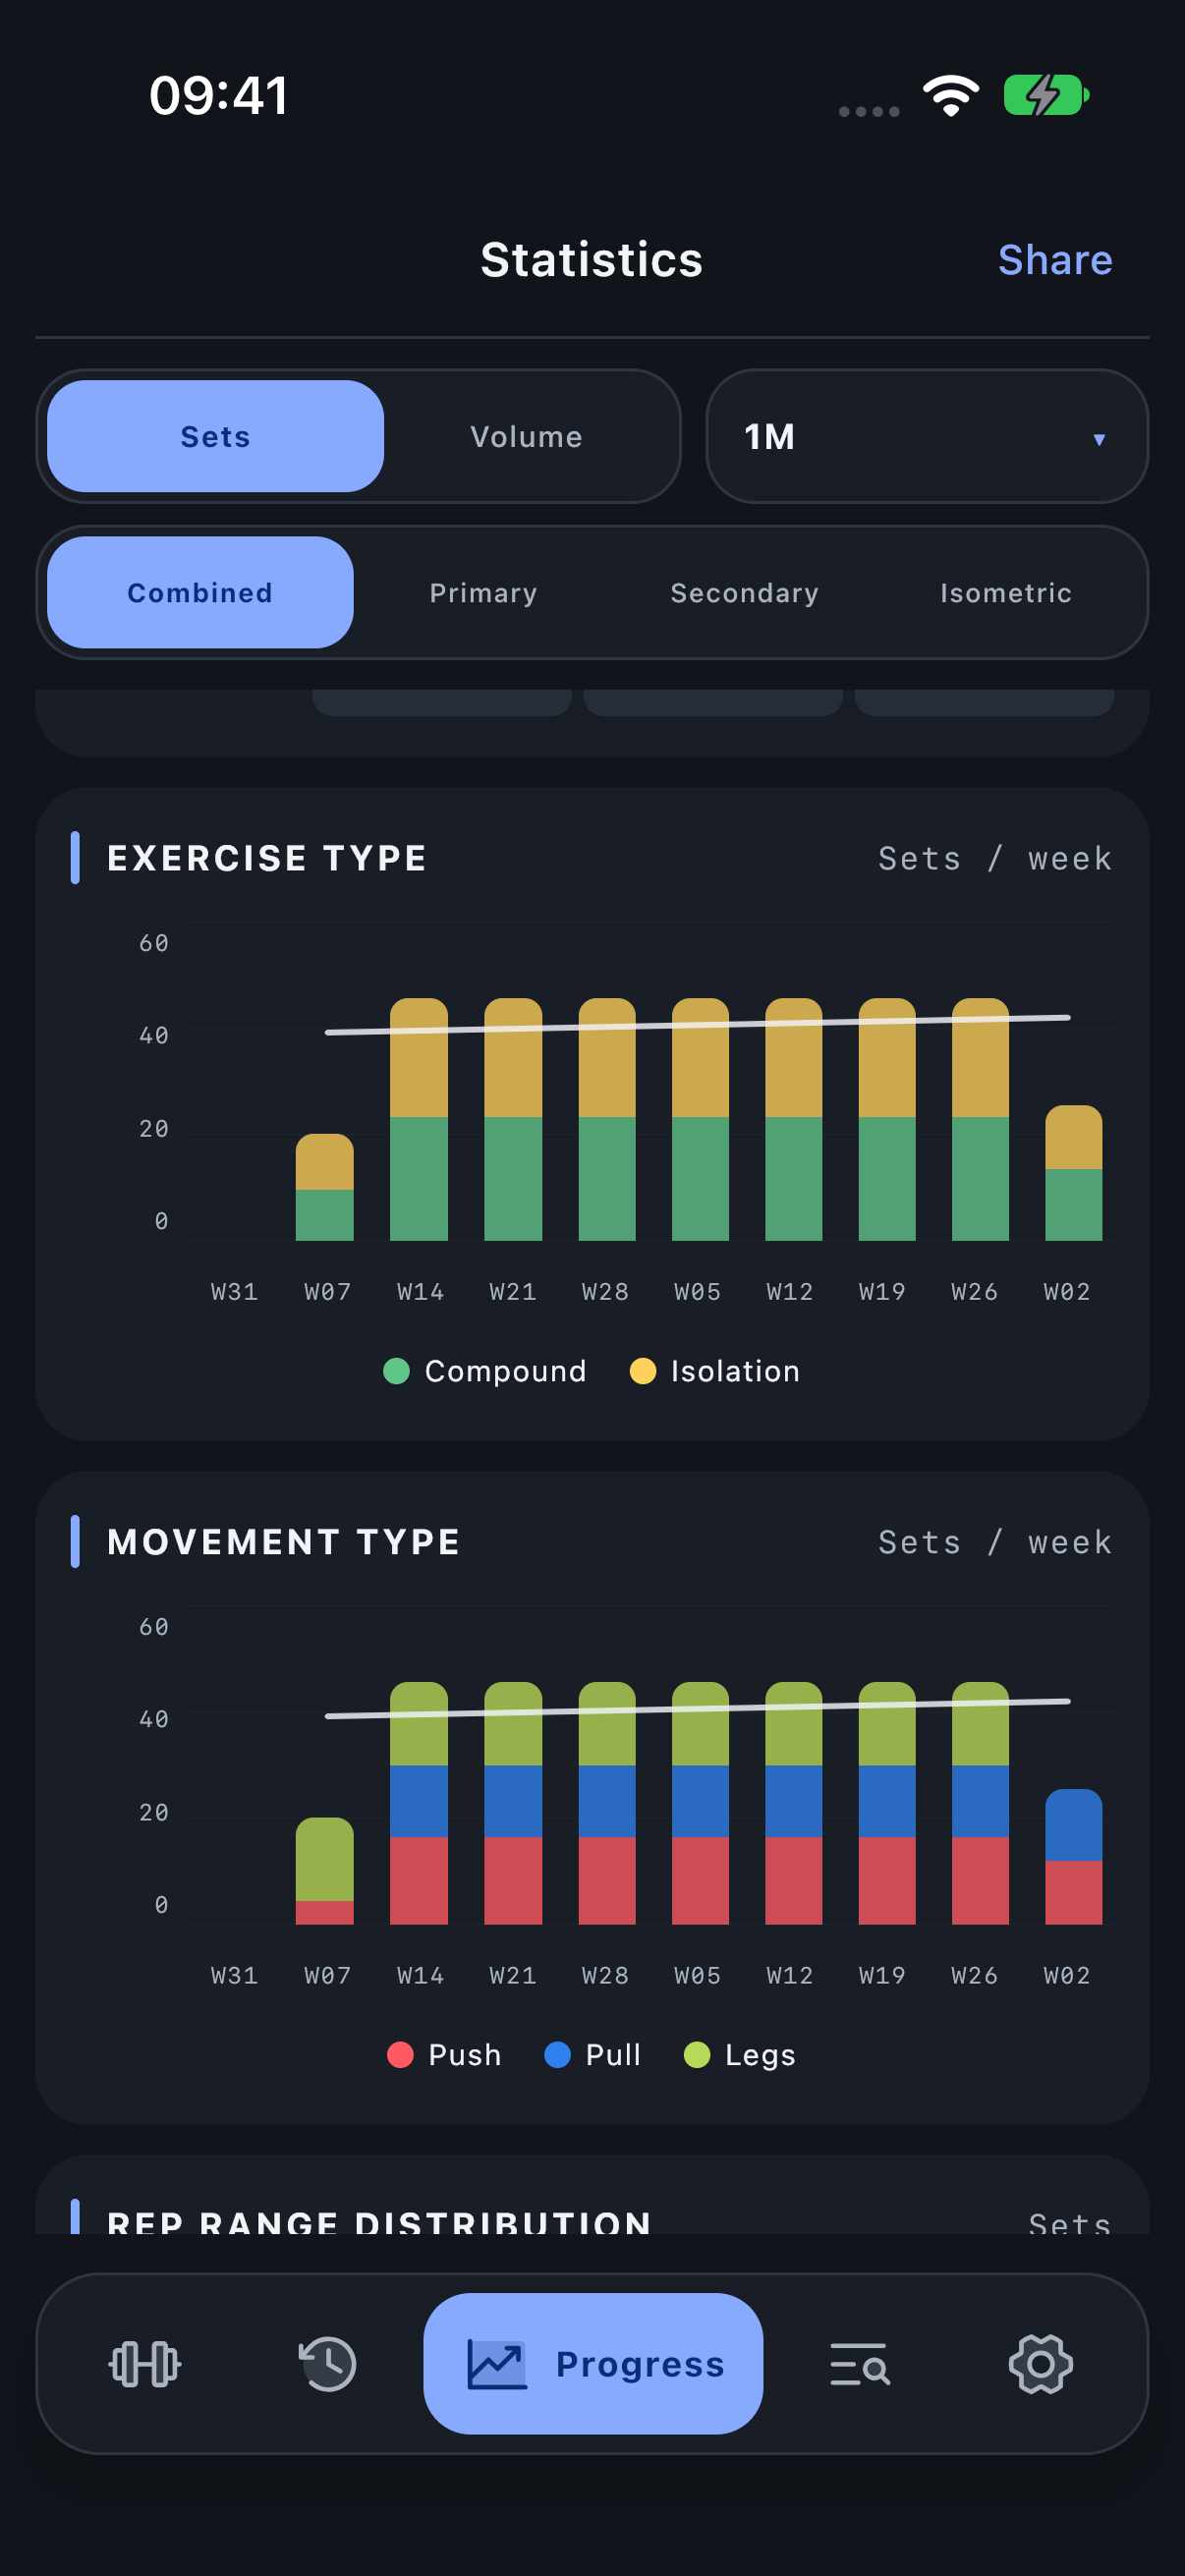
This time chart separates Compound and Isolation work into dated buckets. Unlike the donut, it shows how the work is distributed through the selected interval.
How to read it
Use the legend to distinguish the two series. A rise in one series may reflect more training days, more sets or heavier recorded work. It is an amount trend, not a direct measure of adaptation.
If Isolation rises while Compound stays steady, the share in the donut may also rise. Inspect the contributing Exercises before interpreting that as a change in your main lifts.
Period, units and filters
The x-axis uses daily buckets in 1W, ten weekly buckets in 1M, and monthly buckets for longer modes. In 1M the ten-week trend deliberately supplies more history than the last-30-days headline total. Sets/Volume determines the vertical values. Read the actual bucket labels instead of assuming every point is one workout. Tap a chart position to inspect its values.
Investigate the result
Compare with the Exercise type donut for the period total and with History for the specific sessions behind a bucket.
Open Progress → Statistics and scroll to the named module.