 TrainNotes
Movement × exercise type
Which combinations make up your training?
What it shows
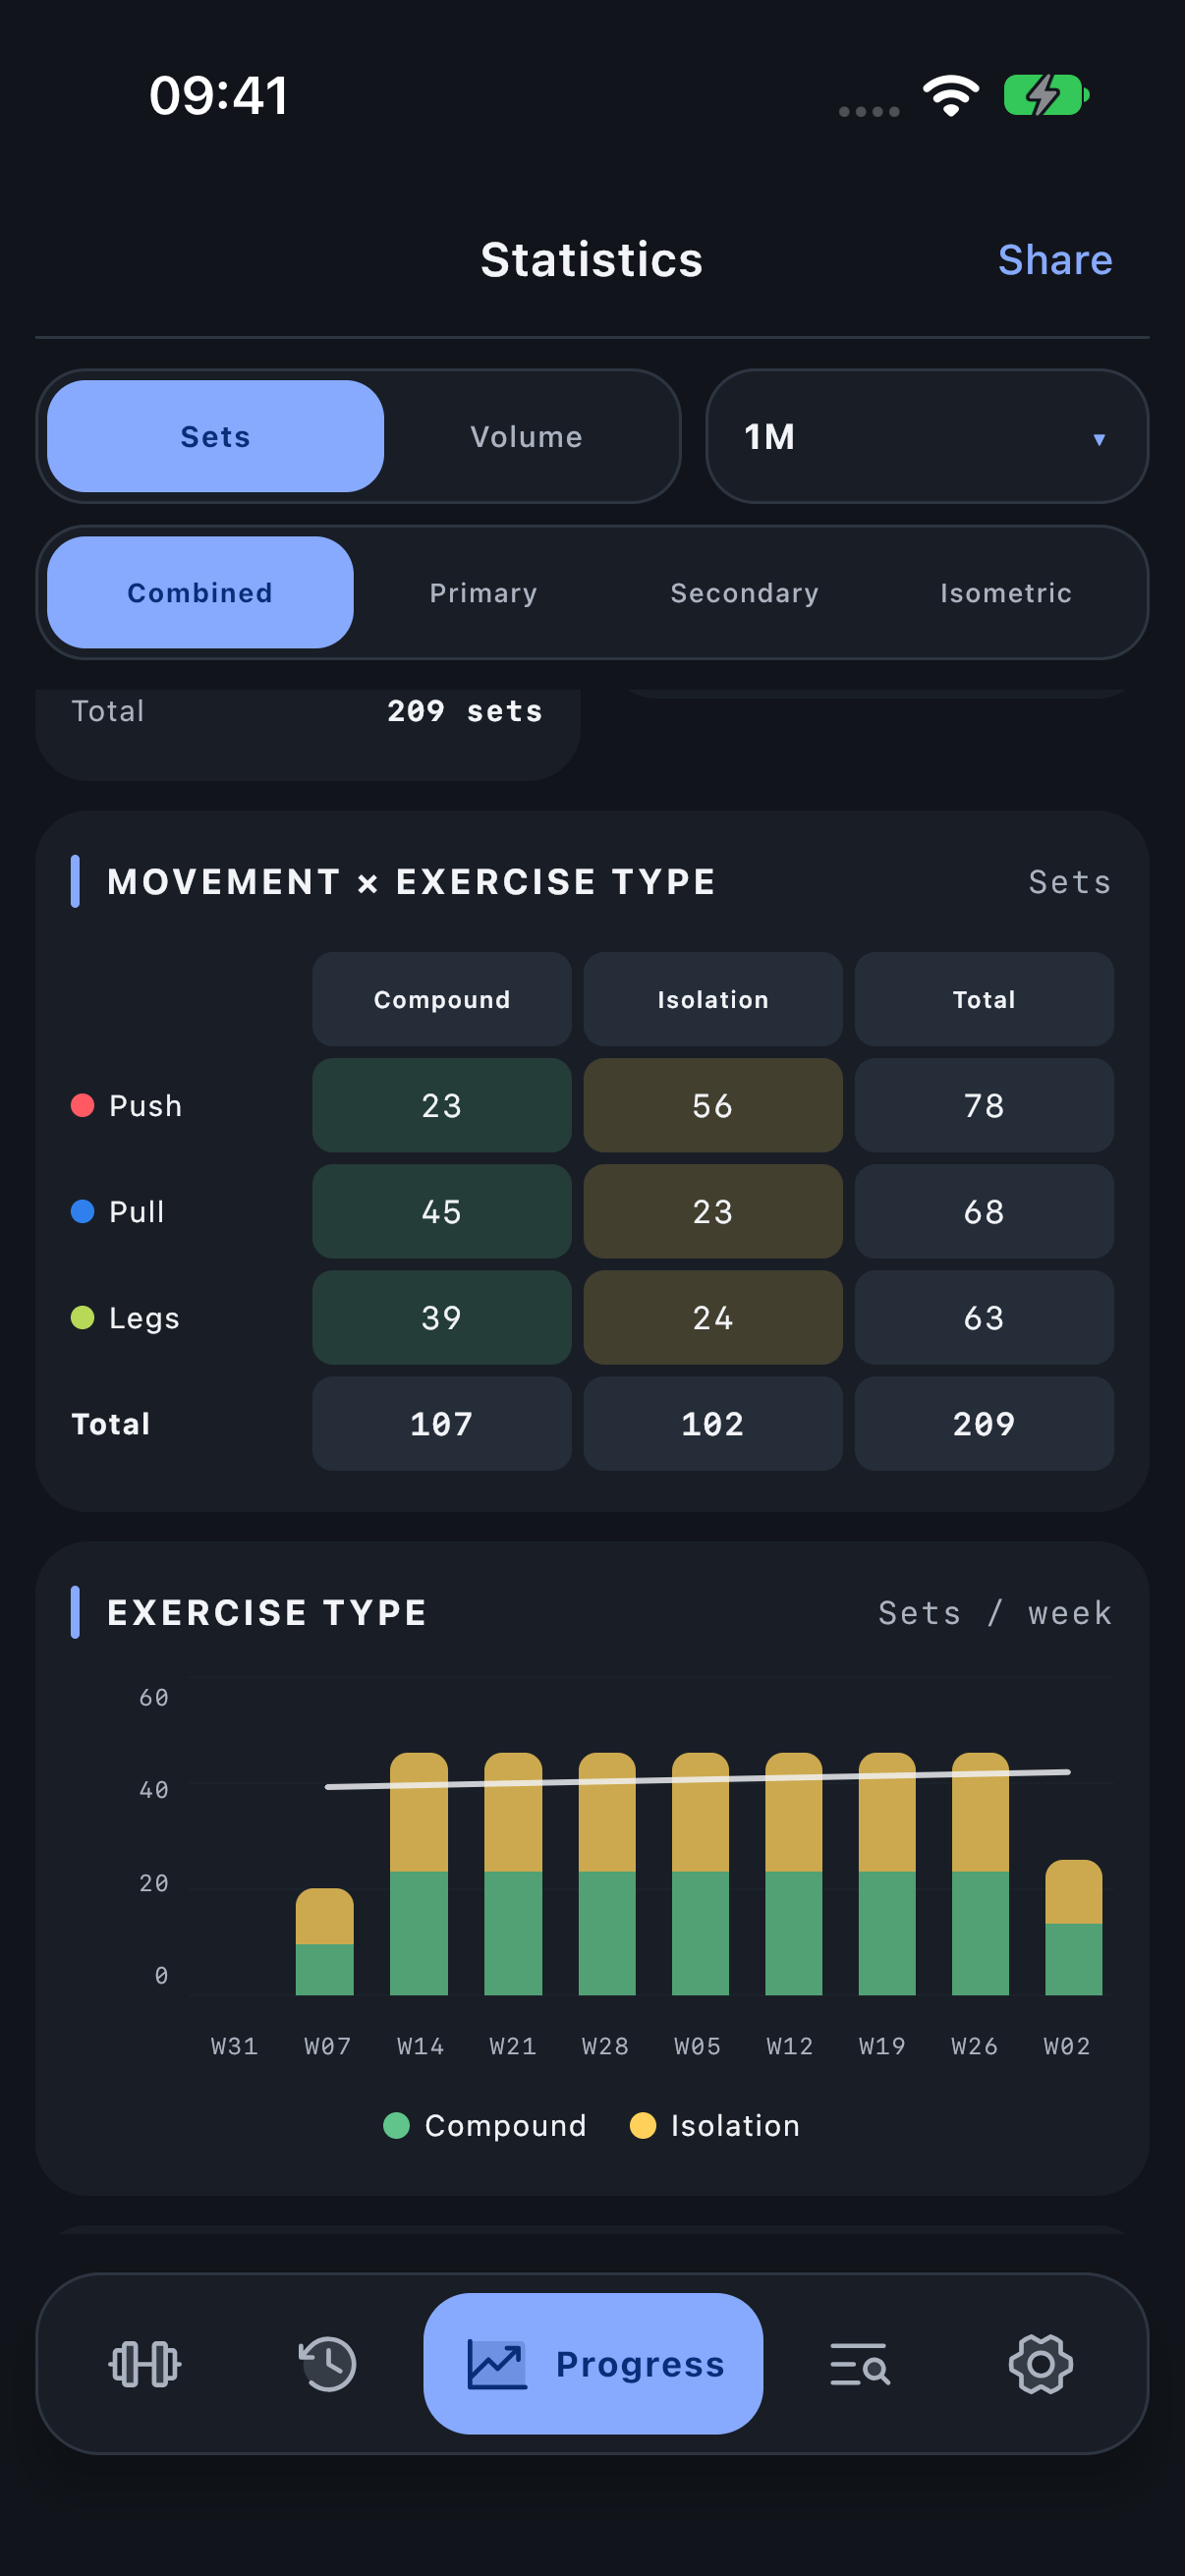
Rows show Push, Pull and Legs. Columns show Compound, Isolation and Total. Each body cell contains the selected metric for that intersection. Row and column totals let you check the breakdown.
How to read it
Choose a row and column, then read their intersection. Tap a numeric cell to open its classification detail and the contributing Exercises. A total cell broadens the selection to its row or column. Compact display values are rounded after the contributions are summed; visible cell labels may therefore differ slightly from the visible total when added by hand.
Push × Isolation narrows the list to isolation pushing Exercises, while Push × Total includes compound and isolation pushes. This is useful when a large Push donut slice leaves you wondering what actually produced it. In the screenshot, 22.5 compound and 55.5 isolation contributions are displayed as 23 and 56, while their actual sum is 78. The total is calculated before the labels are rounded.
Check the combination you opened
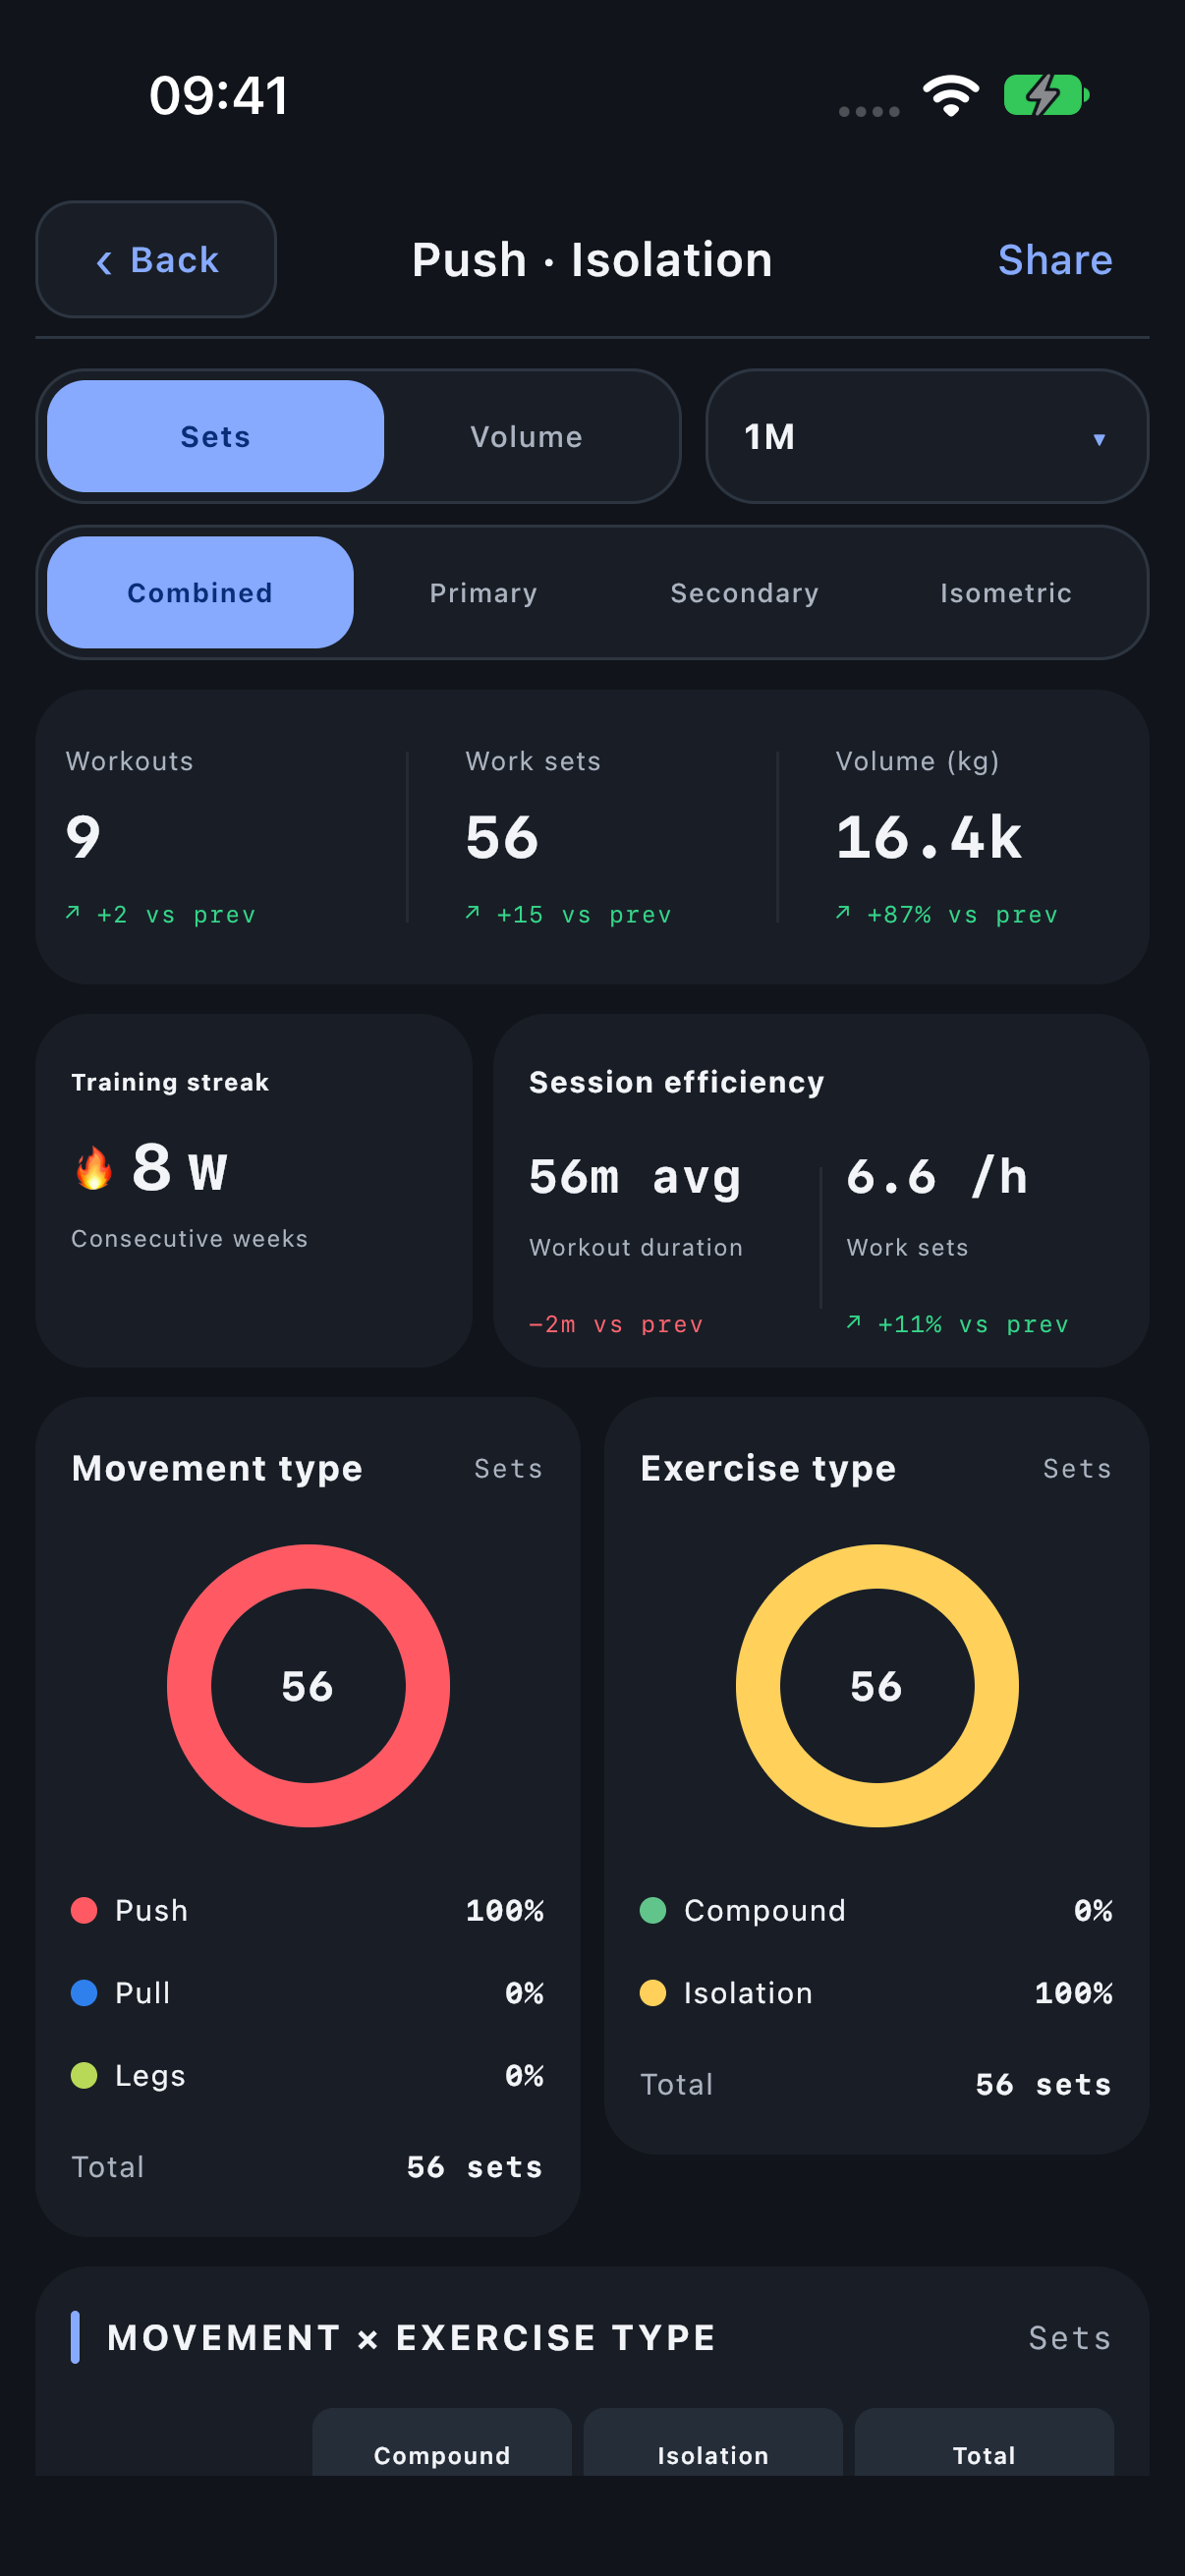
After tapping Push × Isolation, check the Push · Isolation title. The overview and charts now describe that intersection. A 100% Isolation donut is expected after this filter; it does not mean all of your training is isolation work.
Read the filtered Exercise list
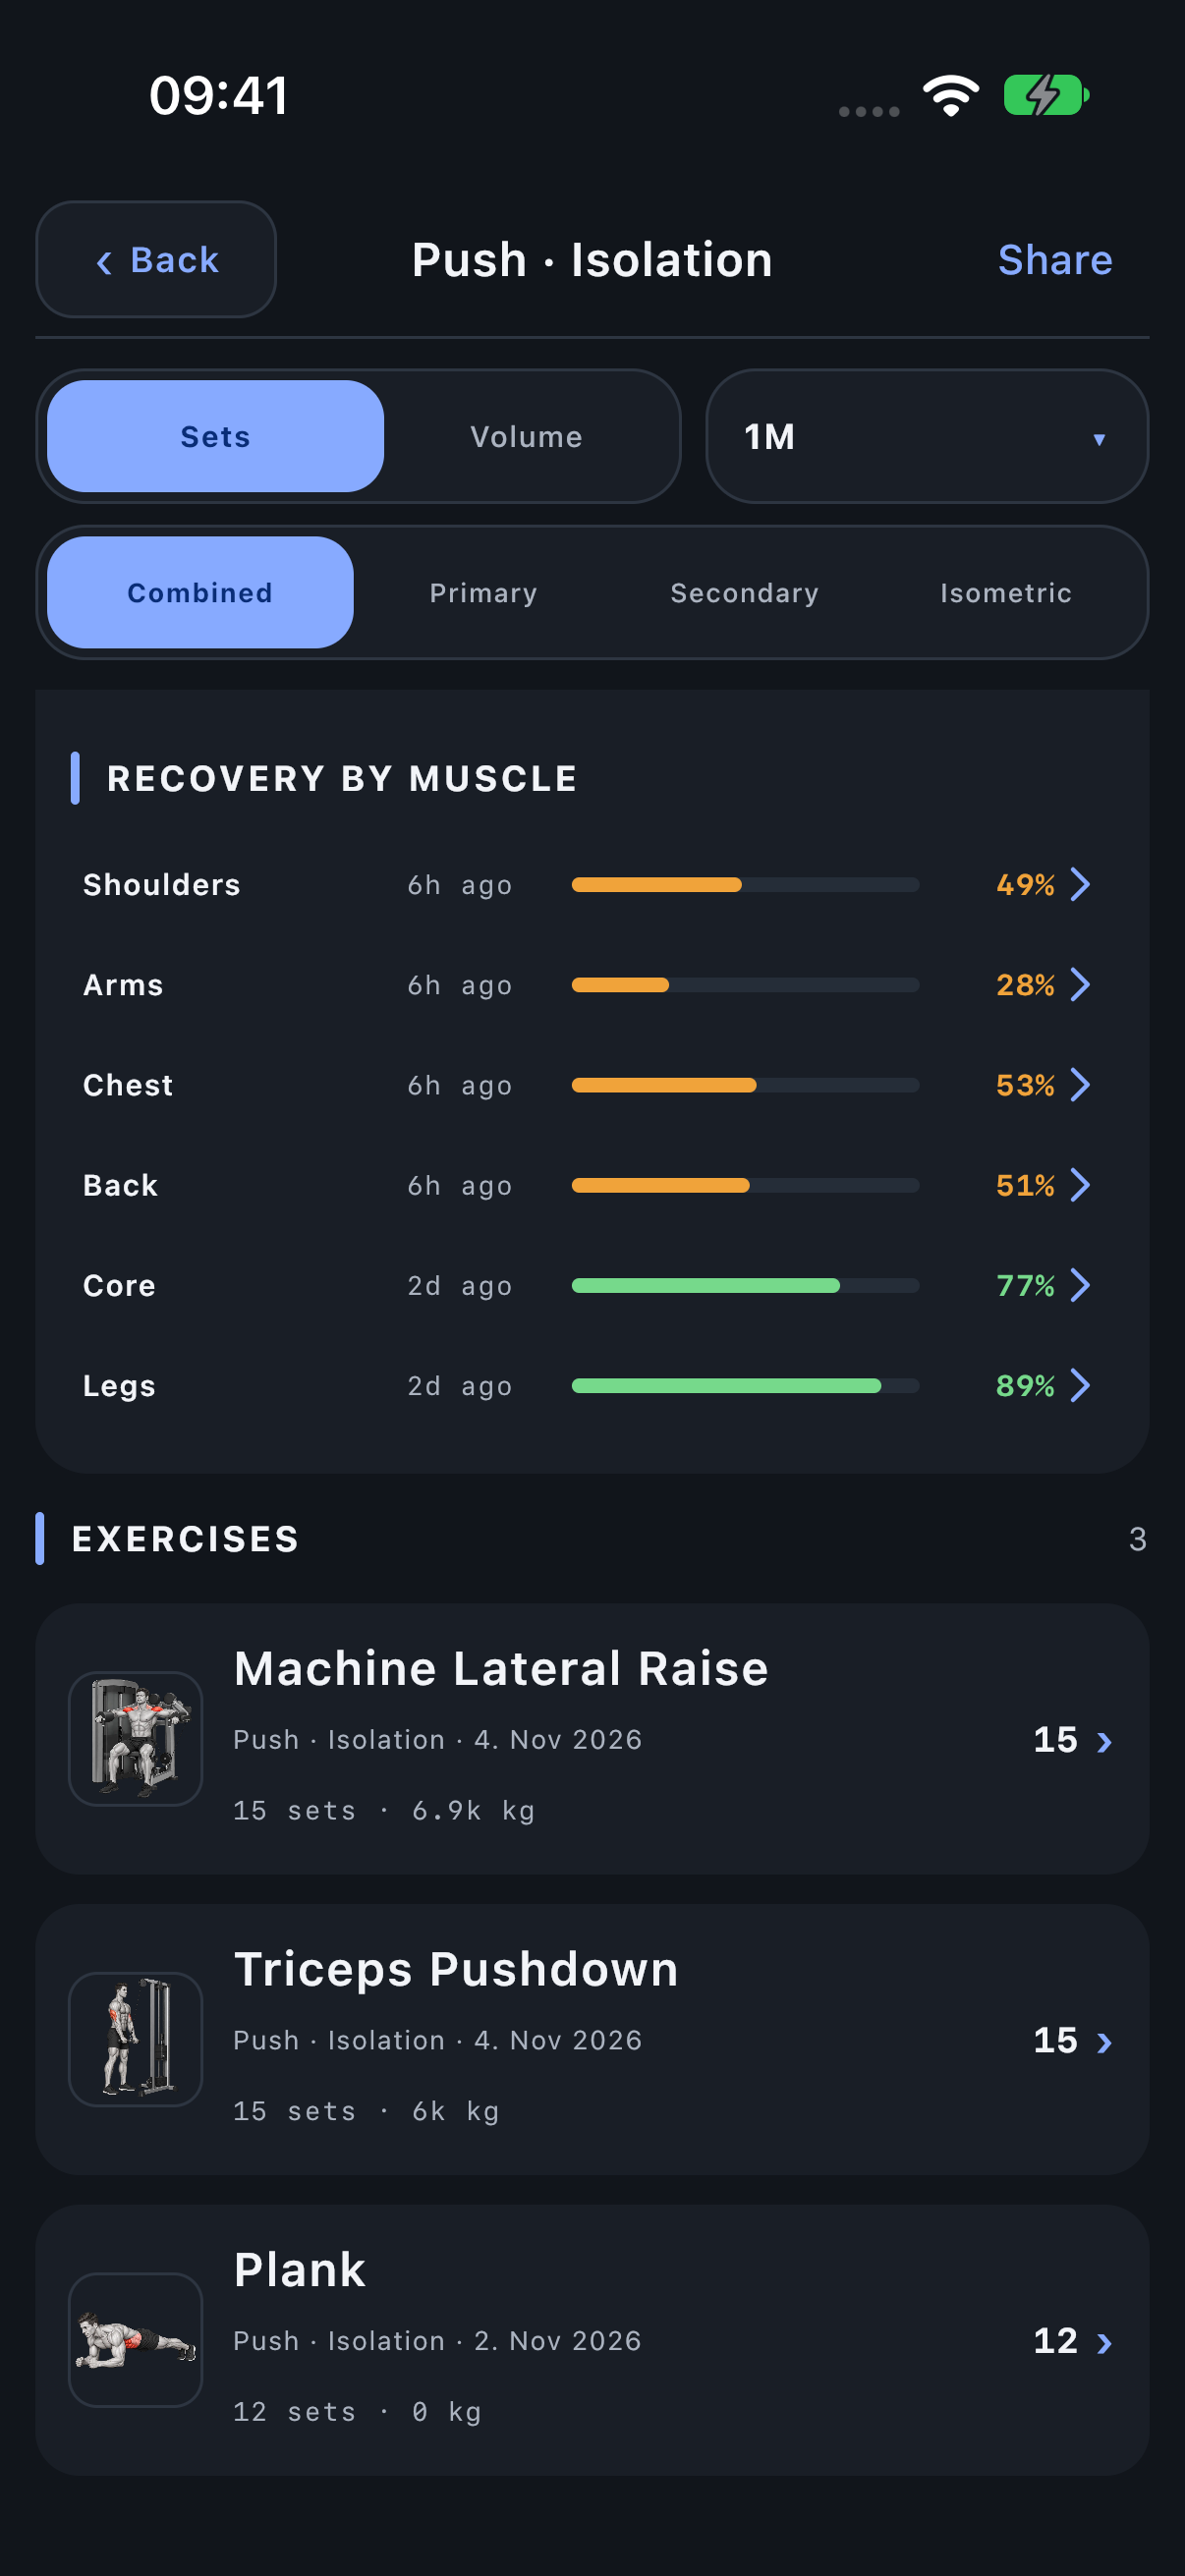
Scroll to Exercises to see which movements contributed to the intersection. Open an Exercise row for its recorded work, or use Share to export the current filtered context.
Period, units and filters
The current period, Sets/Volume and muscle-role scope apply. In Volume, a cell is summed effective load × successful reps with the selected role weights rather than a set count; read the weight unit shown in the card header.
Investigate the result
In the detail screen, review the listed Exercises or Share that filtered view. Back returns to the parent statistics context.
Open Progress → Statistics and scroll to the named module.