 TrainNotes
Explore the muscle map
Use the anatomical map to locate the muscles involved in your logged training, then inspect the contribution for a group or a single muscle. The workload map and the recovery map answer different questions.
Find the workload map
- Open Progress and choose a period.
- Choose Sets and an involvement role.
- Scroll to Muscle activity. The front of the body is on the left and the back is on the right.
- Read the coloured scale below the figures before comparing regions.
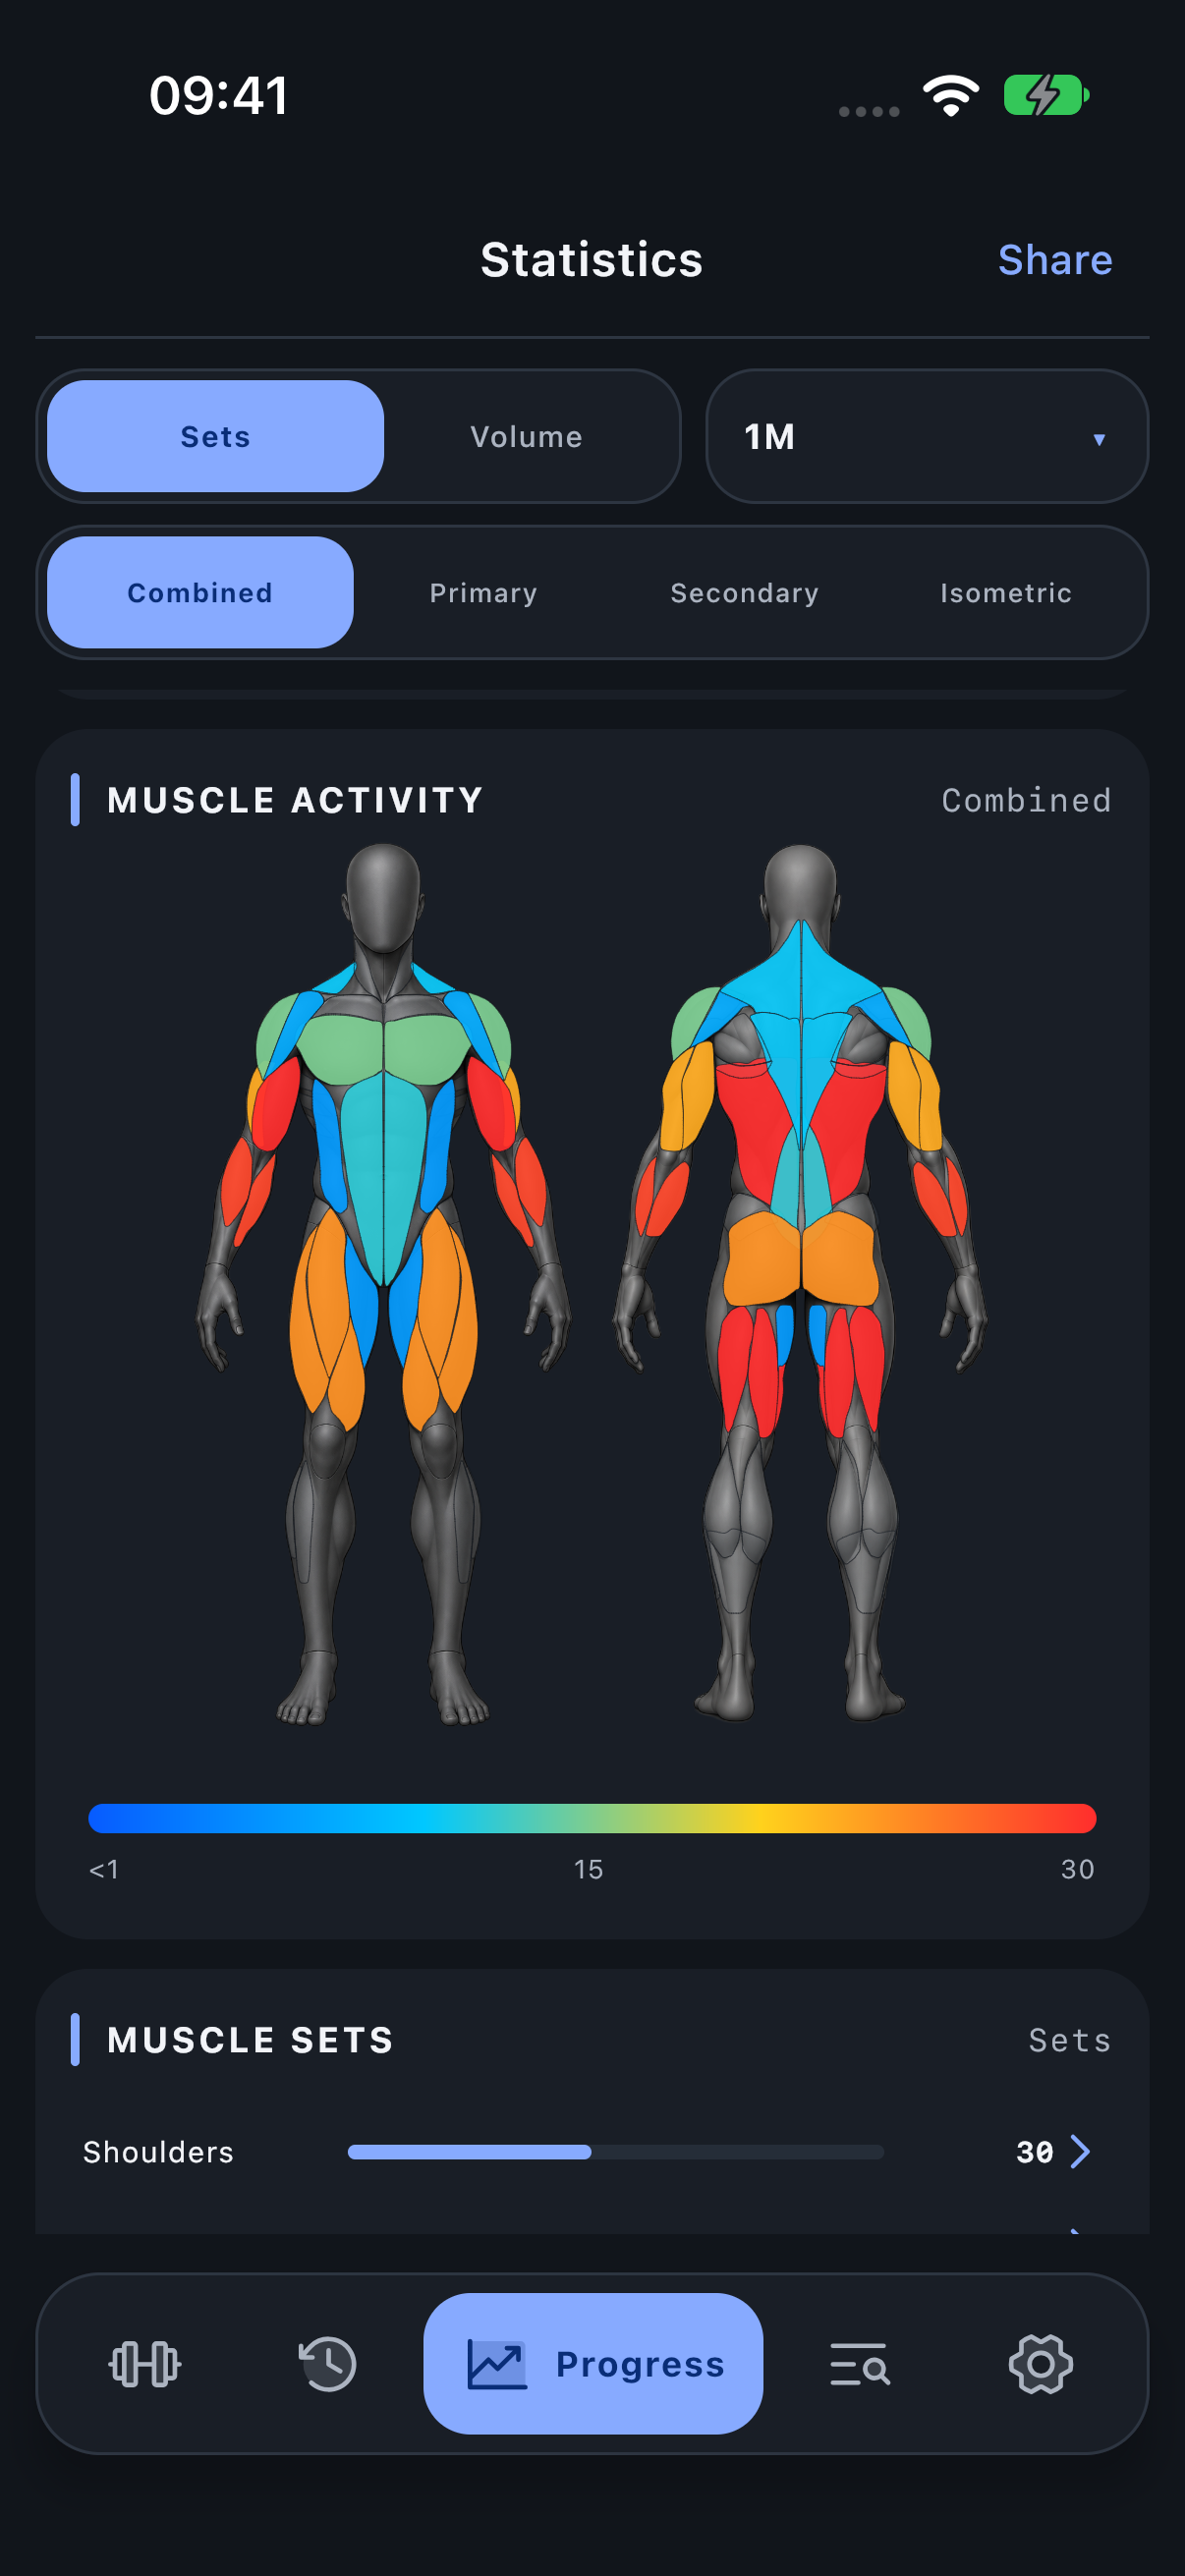
Read the workload colours
Colours encode recorded contribution: lower nonzero values are toward blue and higher values toward red. Uncoloured regions have no displayed contribution under the current scope and role. The legend shows the numeric scale used for this view.
The colour scale adapts to the data. A red region means relatively high contribution in this view; it does not mean pain, injury, overtraining or a measured physiological response. Changing the period or filters can change both the values and the scale.
If the legend runs to 30 sets, its middle label is 15. A similar colour in a different view whose legend runs to 60 represents a different amount. Compare the legend and numeric rows, not the colour alone.
Separate the involvement roles
Primary shows the main role assigned to Exercises. Secondary shows assisting work. Isometric shows additional holding or stabilization. Main targets remain Primary even when the work is static. Combined combines the roles with weights 1.0, 0.5 and 0.25.
Use the same role when comparing two periods. Compound lifts can involve several regions, and the combined map includes those assisting contributions.
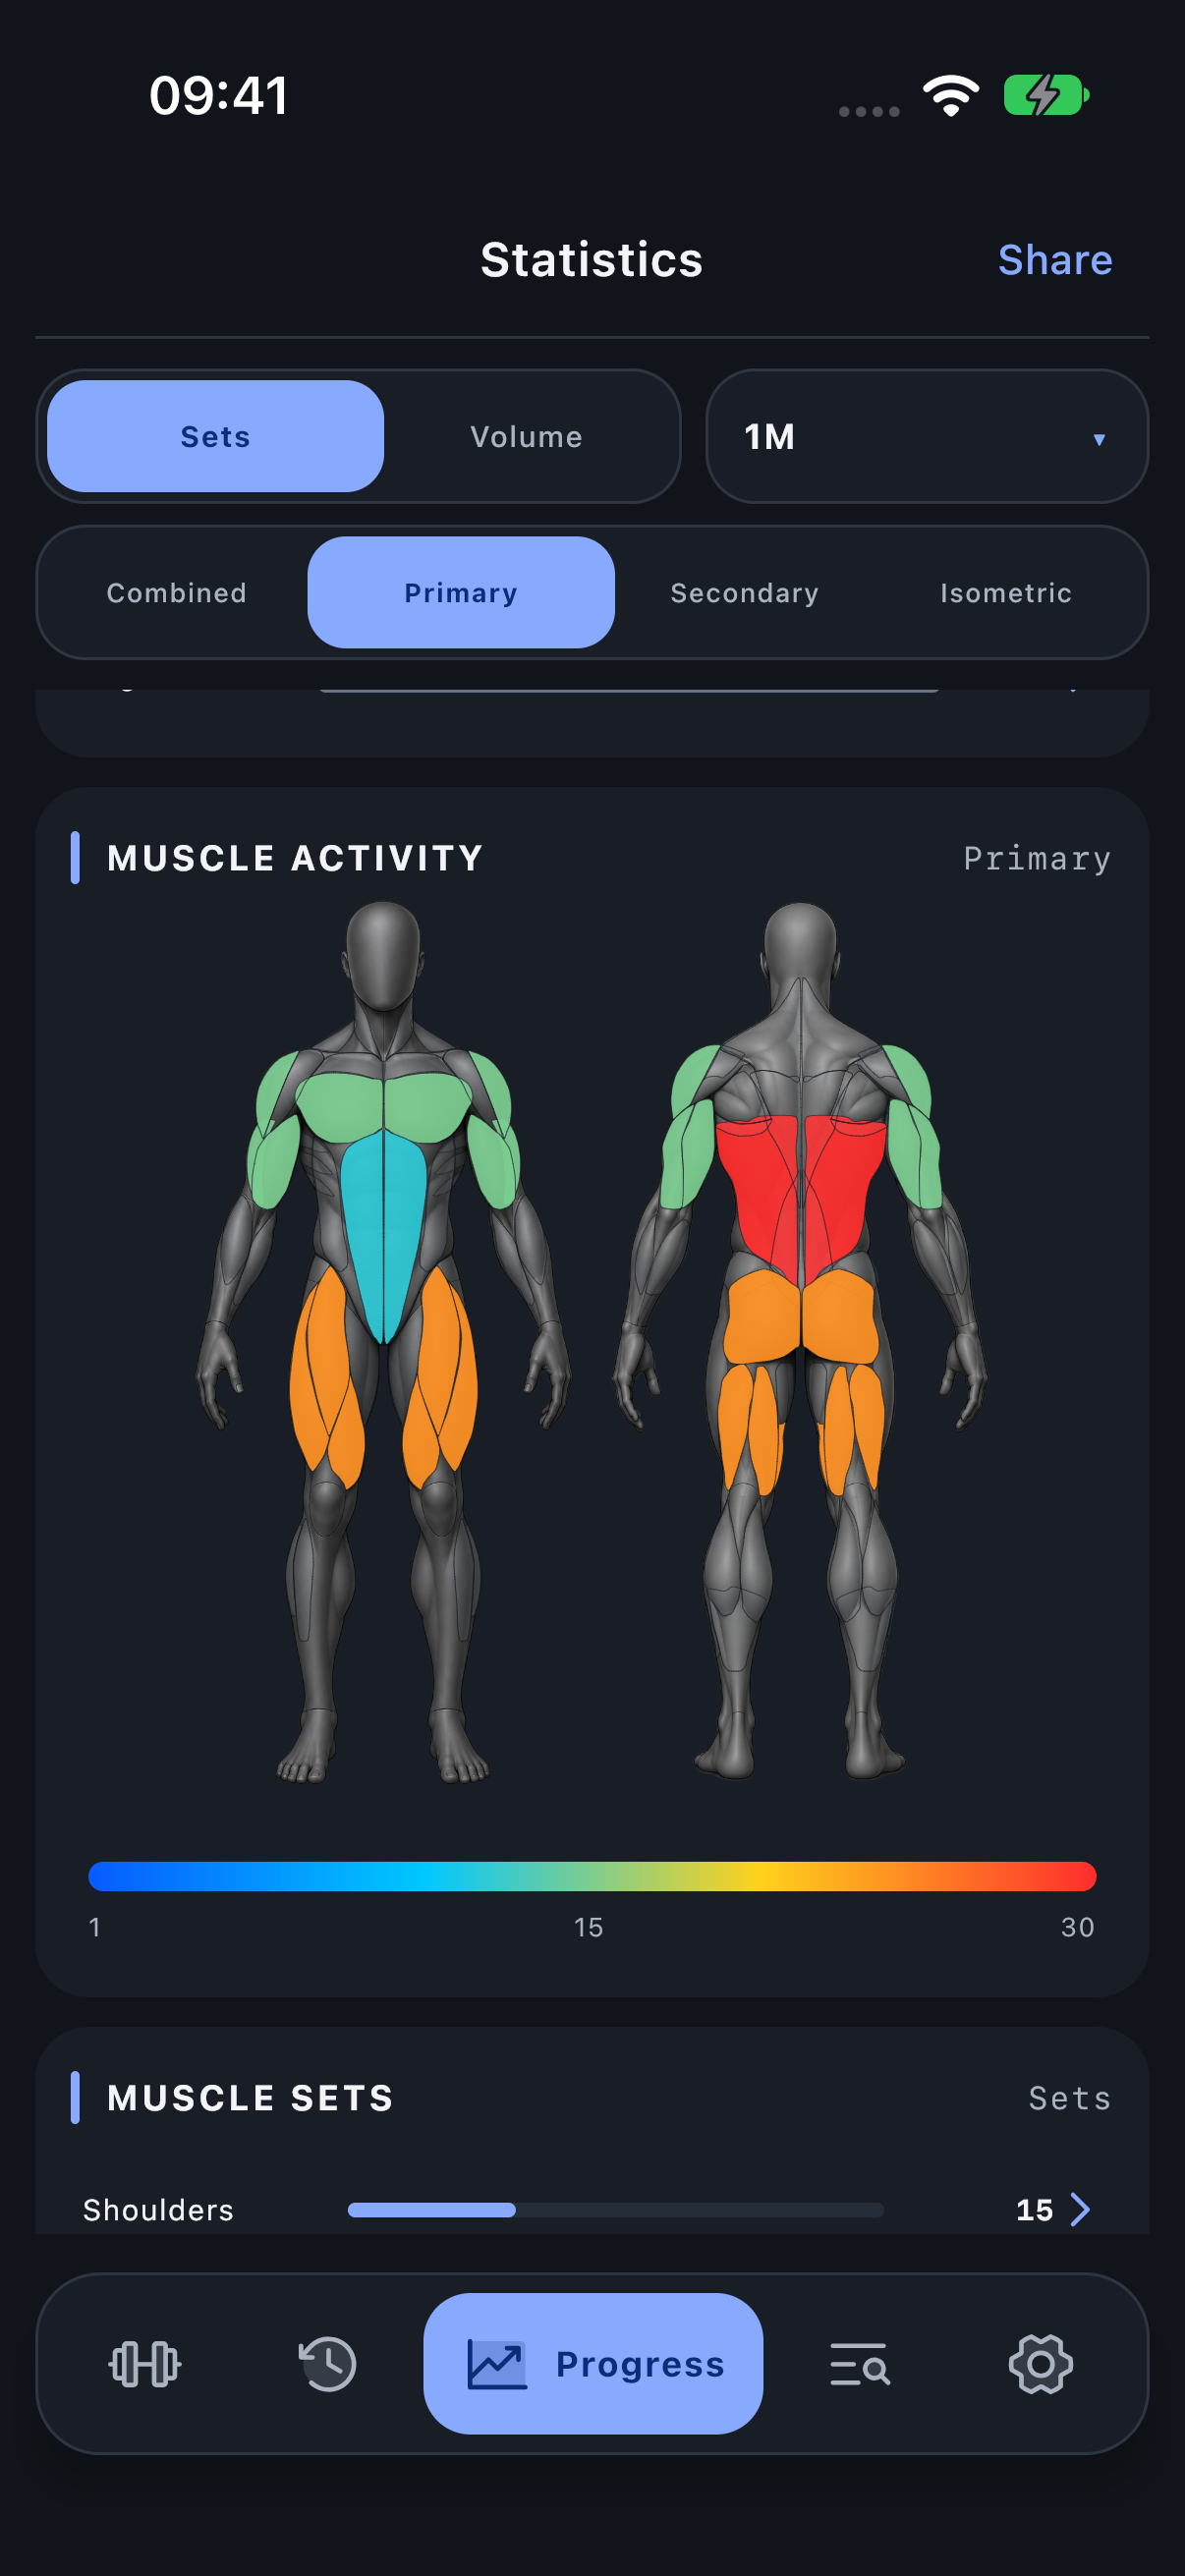
Read Secondary and Isometric views
A muscle can be active in Secondary even if no isolation Exercise directly targeted it. Isometric identifies supporting holding or stabilization; it does not include all statically contracting muscles. A grip hold can still put Forearms in Primary. Only the Exercise’s stored assignments decide these roles; the map does not analyse your form or camera footage.
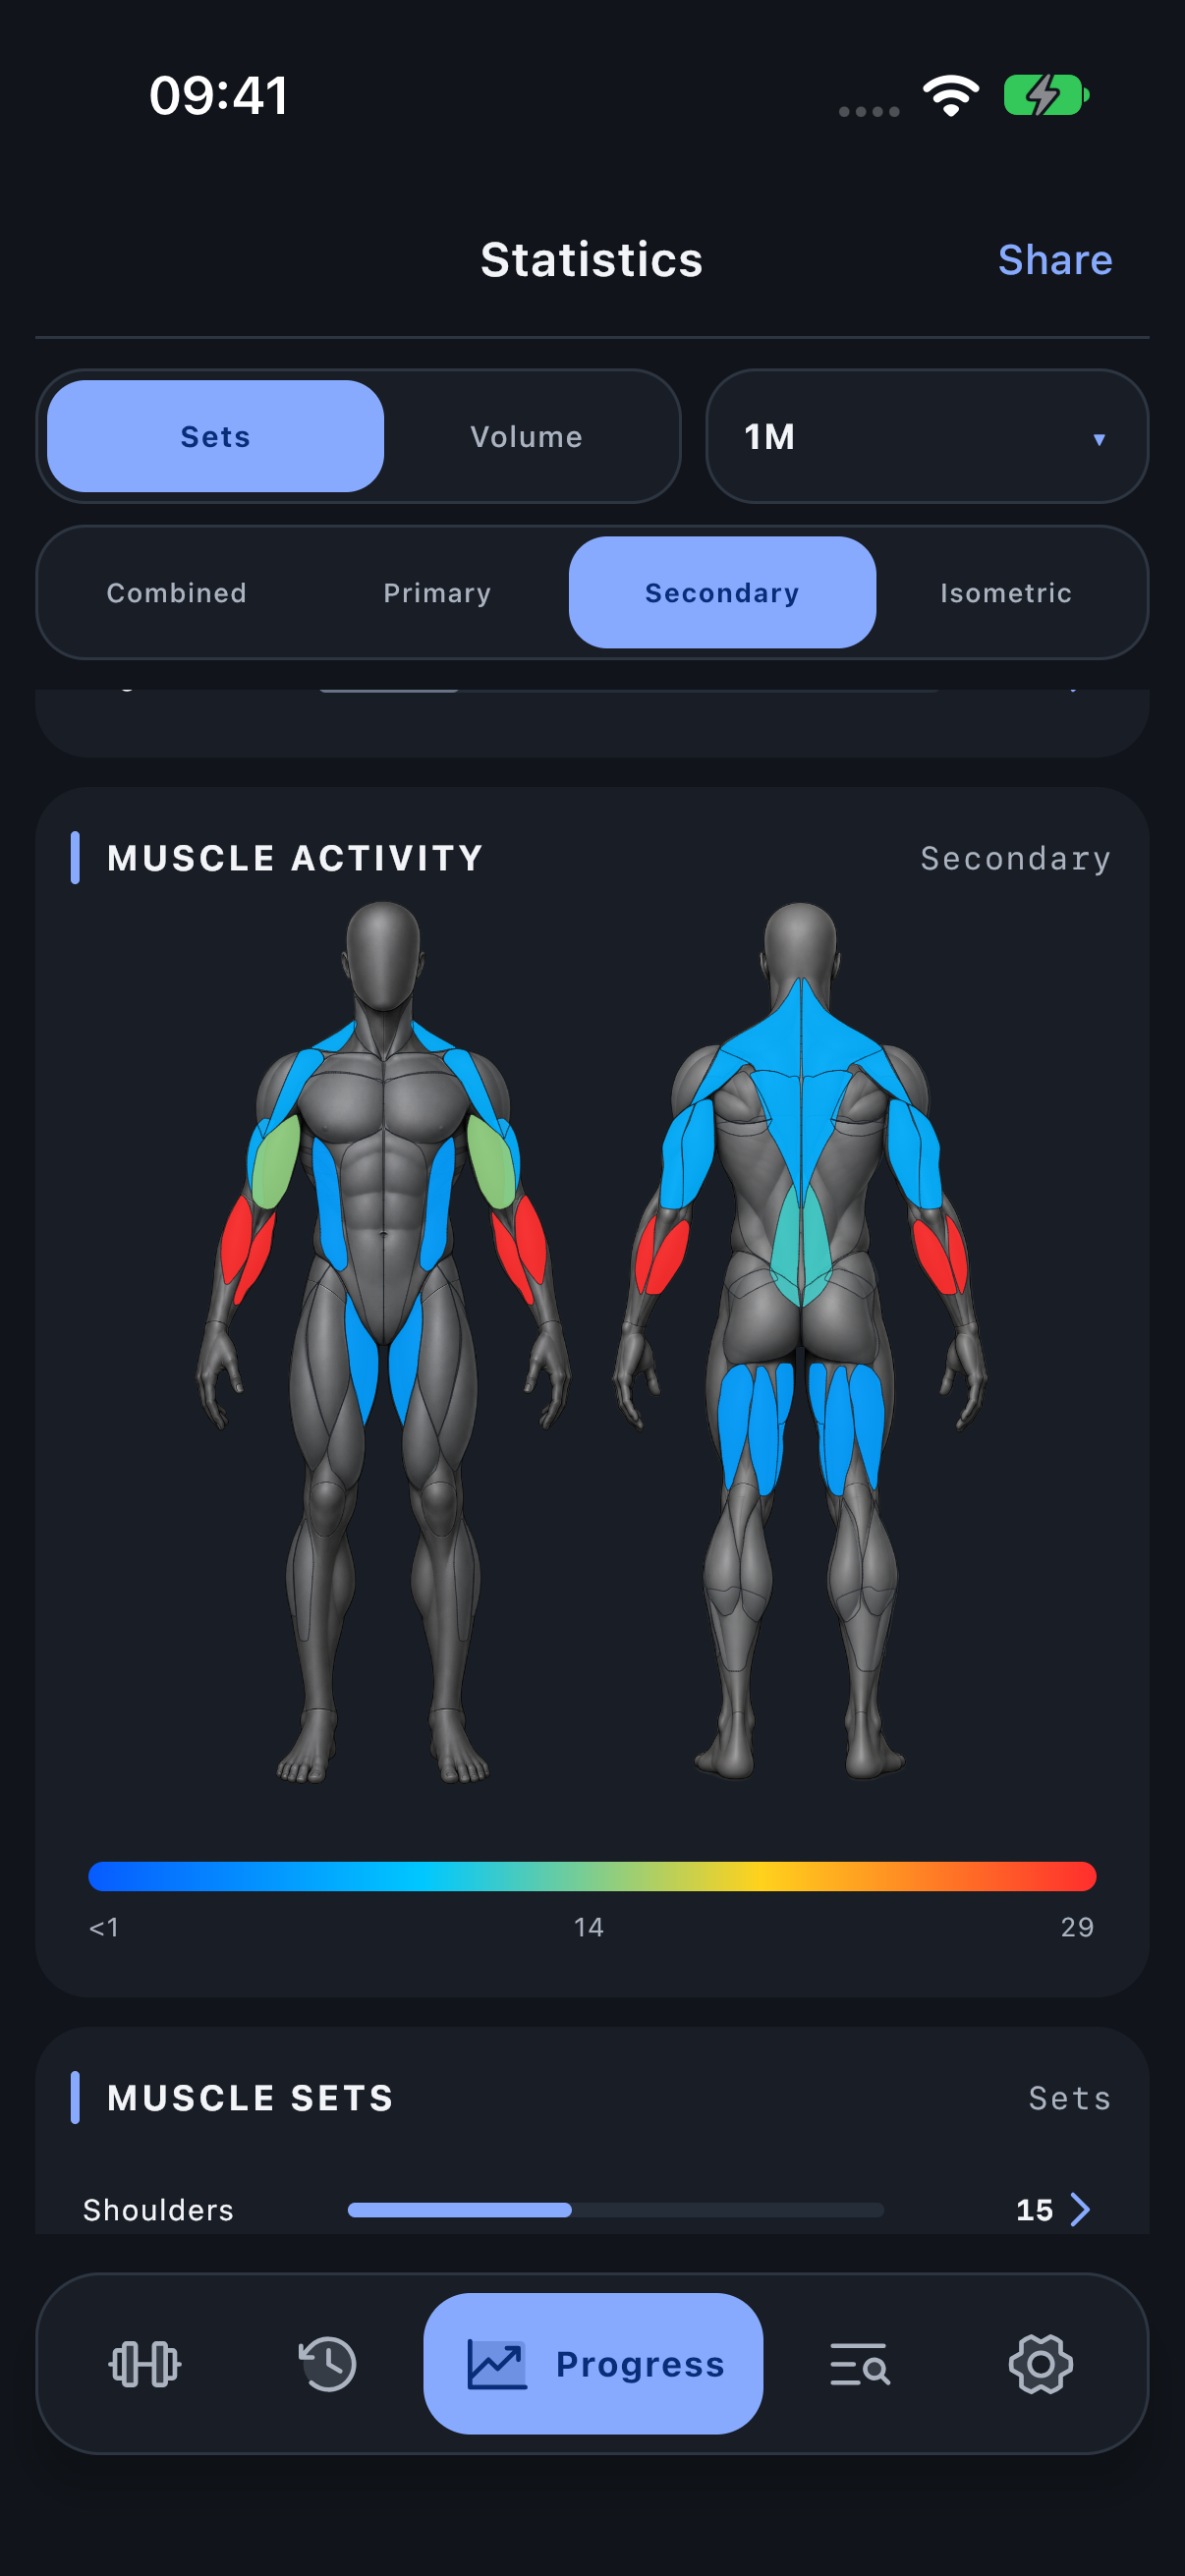
Inspect static contribution
Select Isometric to inspect additional static-support assignments. A mostly uncoloured map can be correct when the selected Exercises have little or no recorded isometric contribution. Do not infer “unused muscle” from an empty role view.
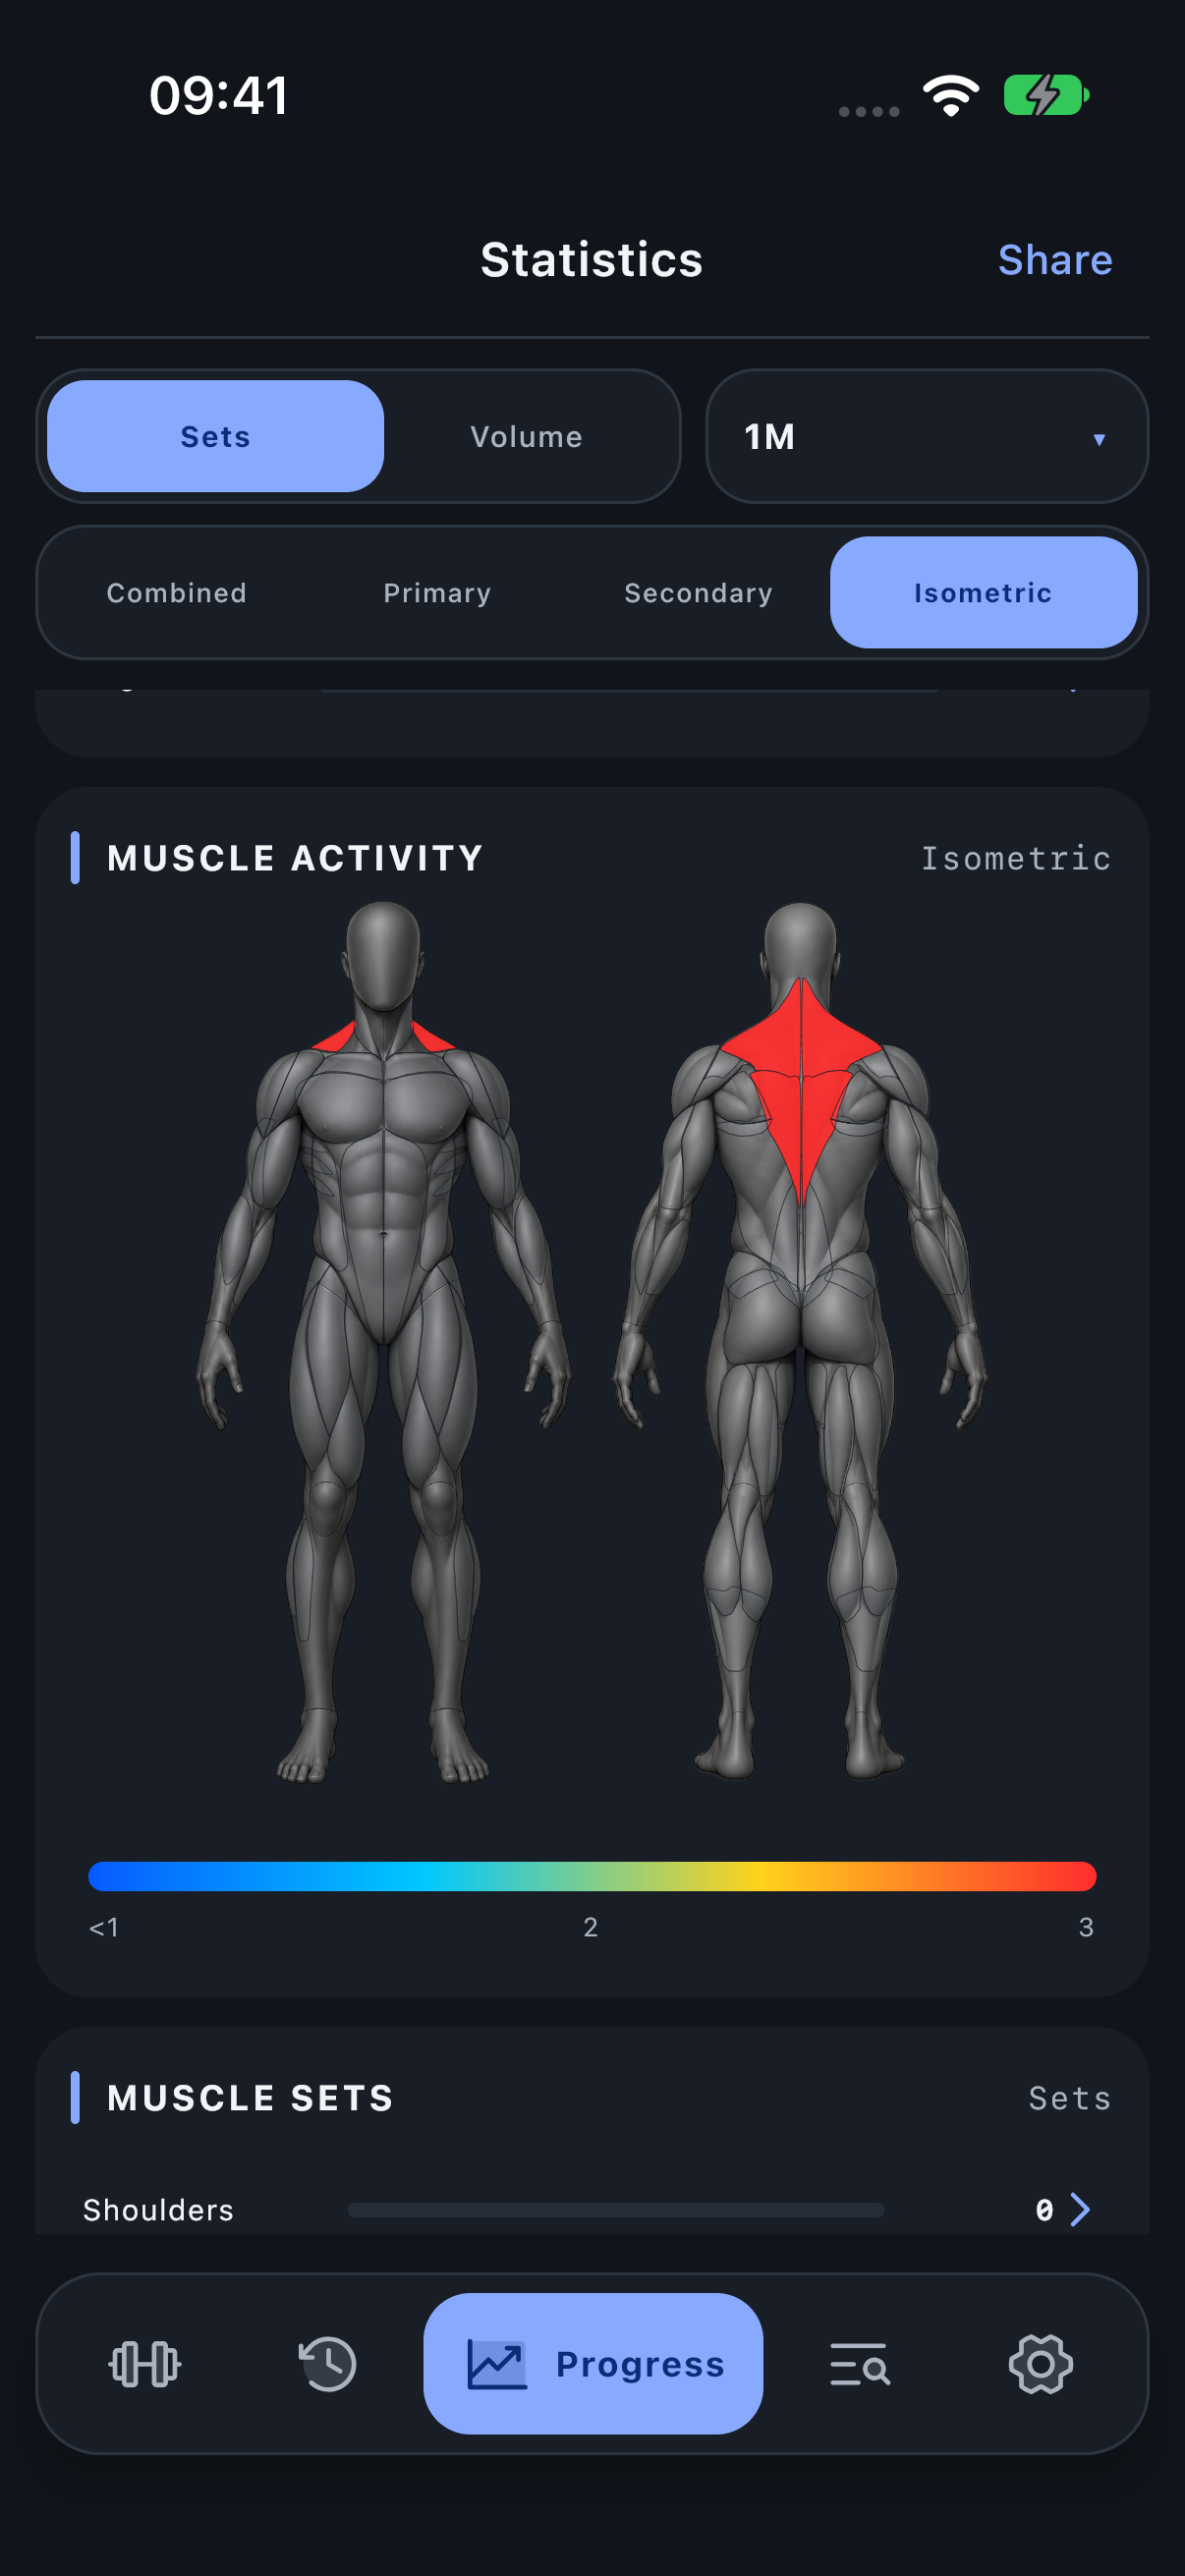
Switch from sets to volume
Select Volume to see effective load × successful reps attributed to the muscles. The scale changes to the selected weight unit. A muscle with many light sets can rank differently from one receiving fewer heavy sets.
Volume reflects how you log an Exercise’s load. Two machines with the same stack number do not necessarily deliver equal resistance. Use Variant progress for comparable machine history.
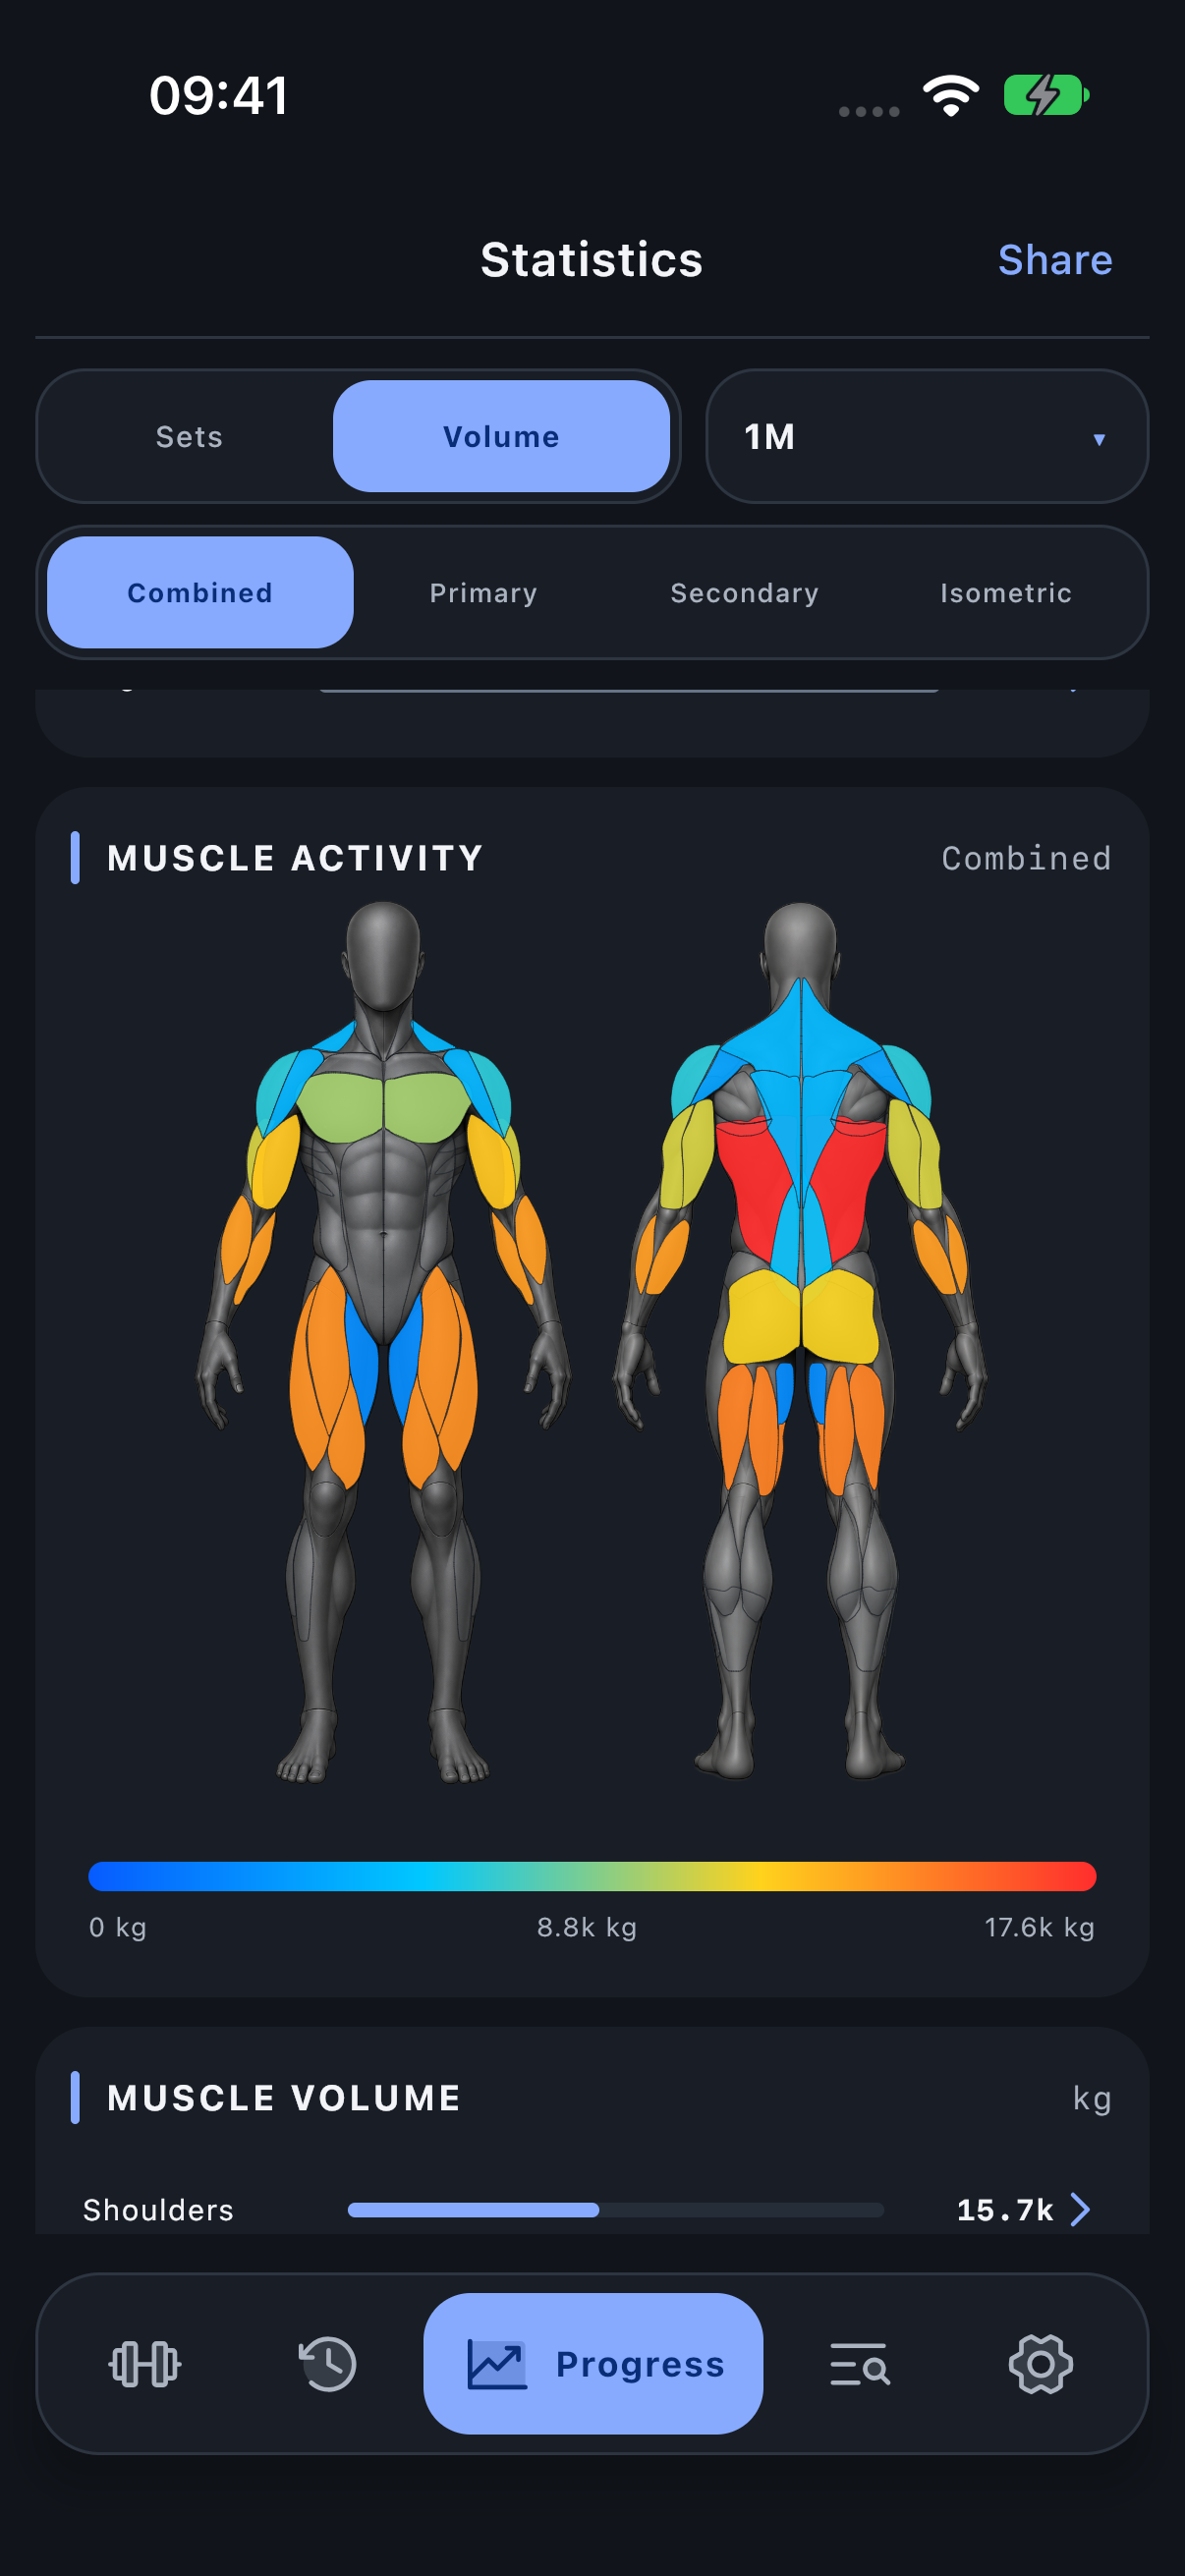
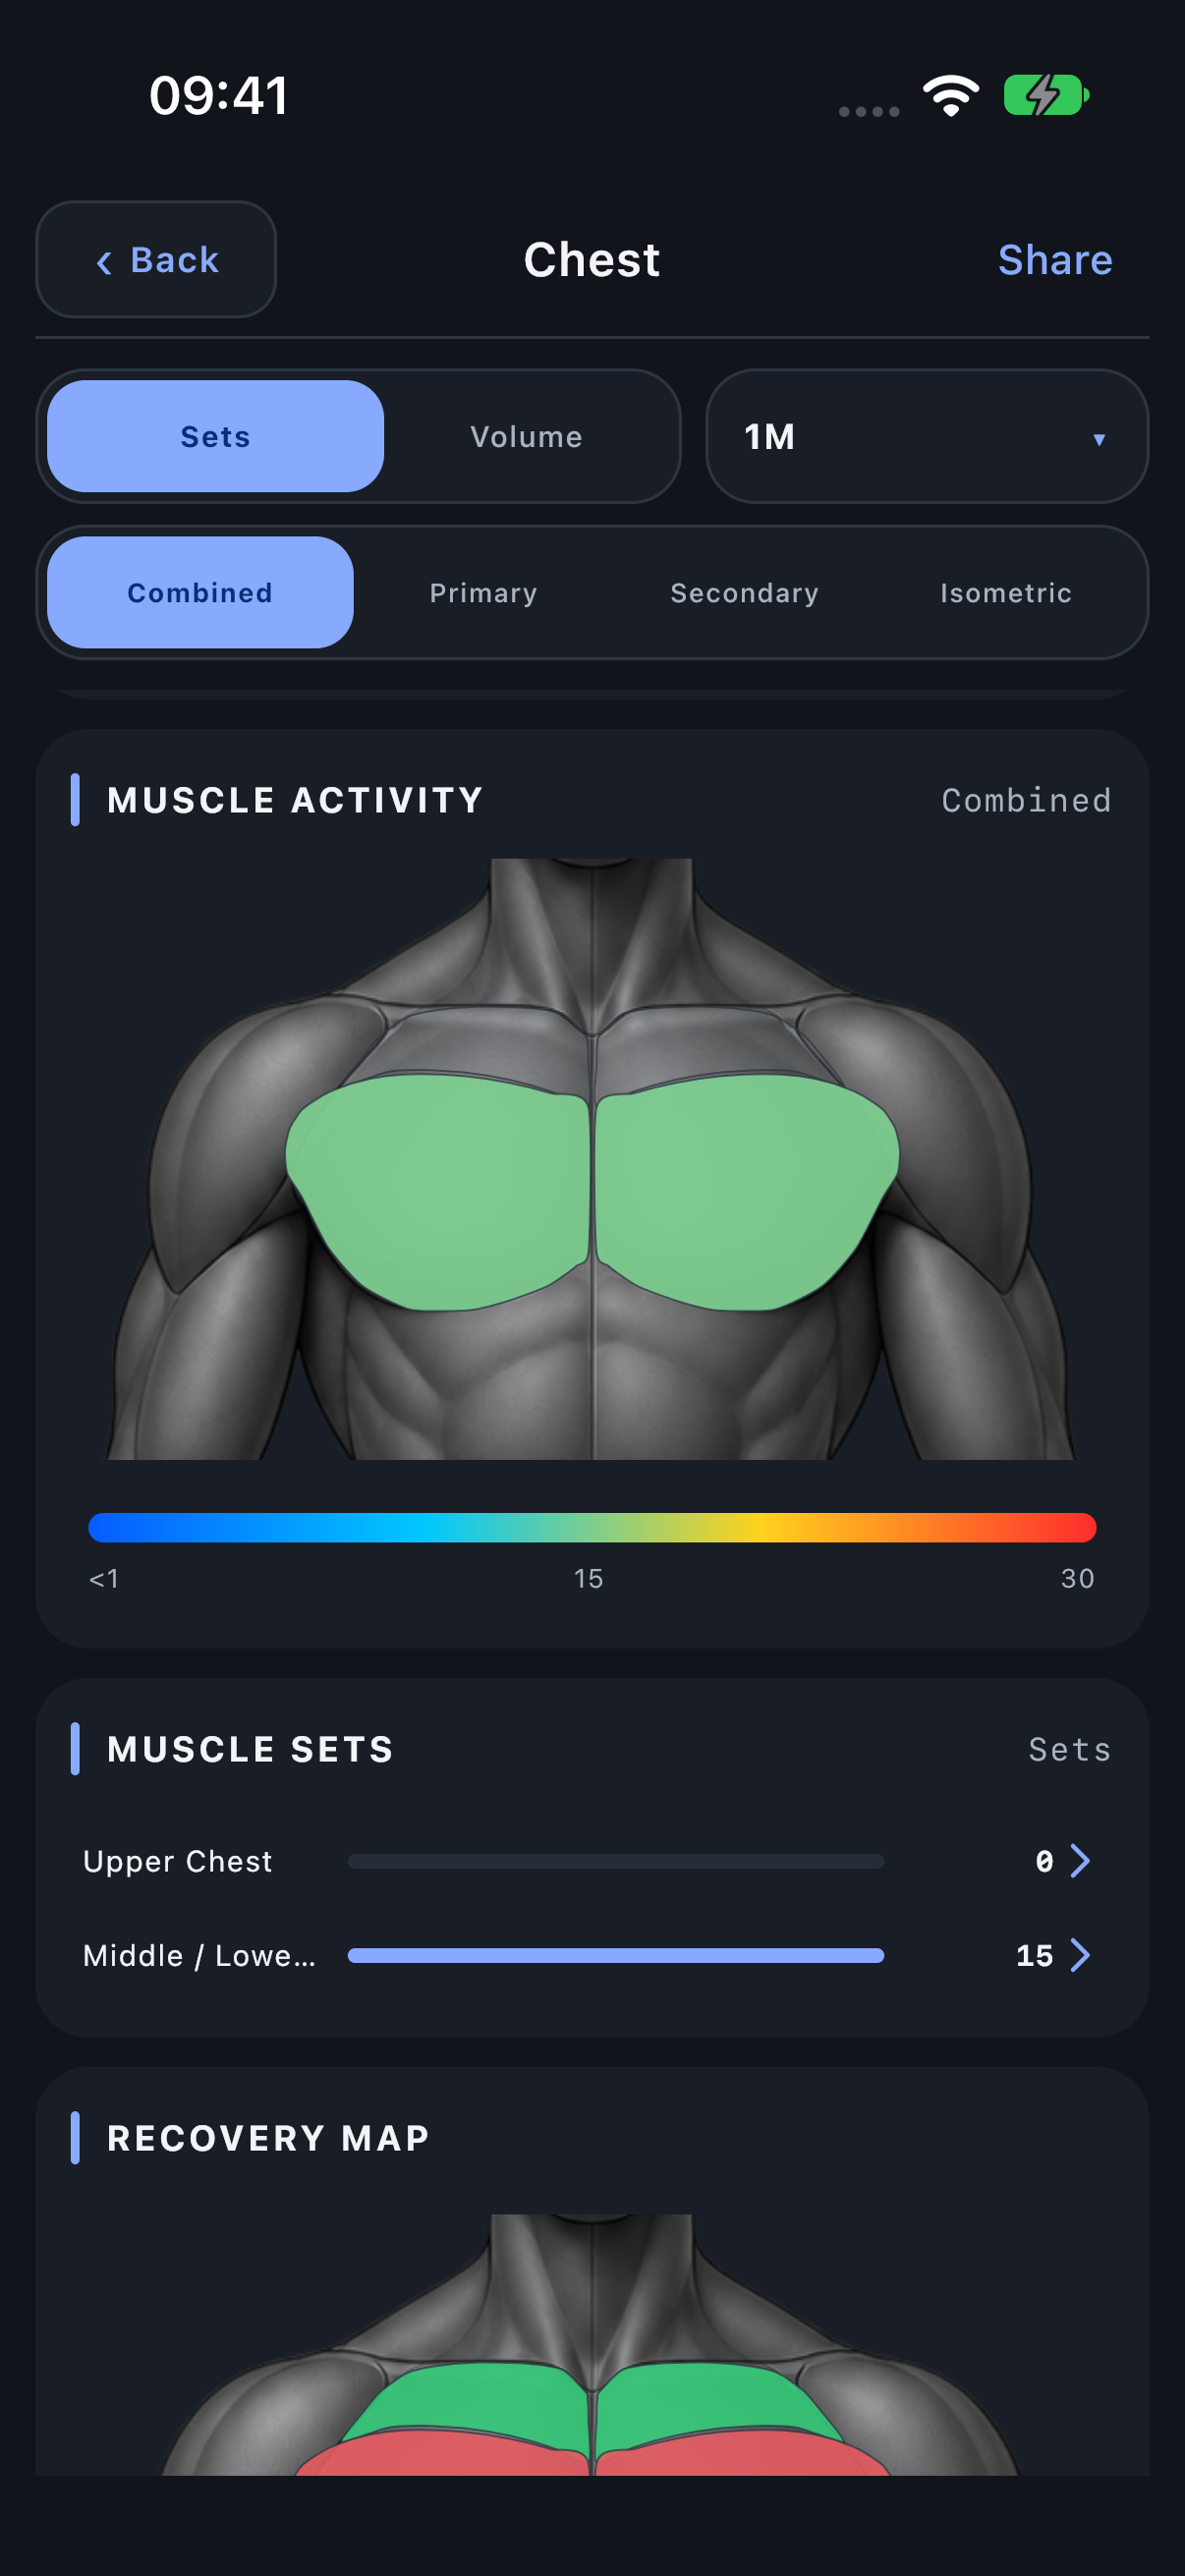
Open a muscle group
- Tap the anatomical region, or use the corresponding row in Muscle sets.
- Check the new screen title, such as Chest.
- Inspect the focused map and the child-muscle rows. The same period, metric and role controls remain available.
- Use Back to return to the broader view.
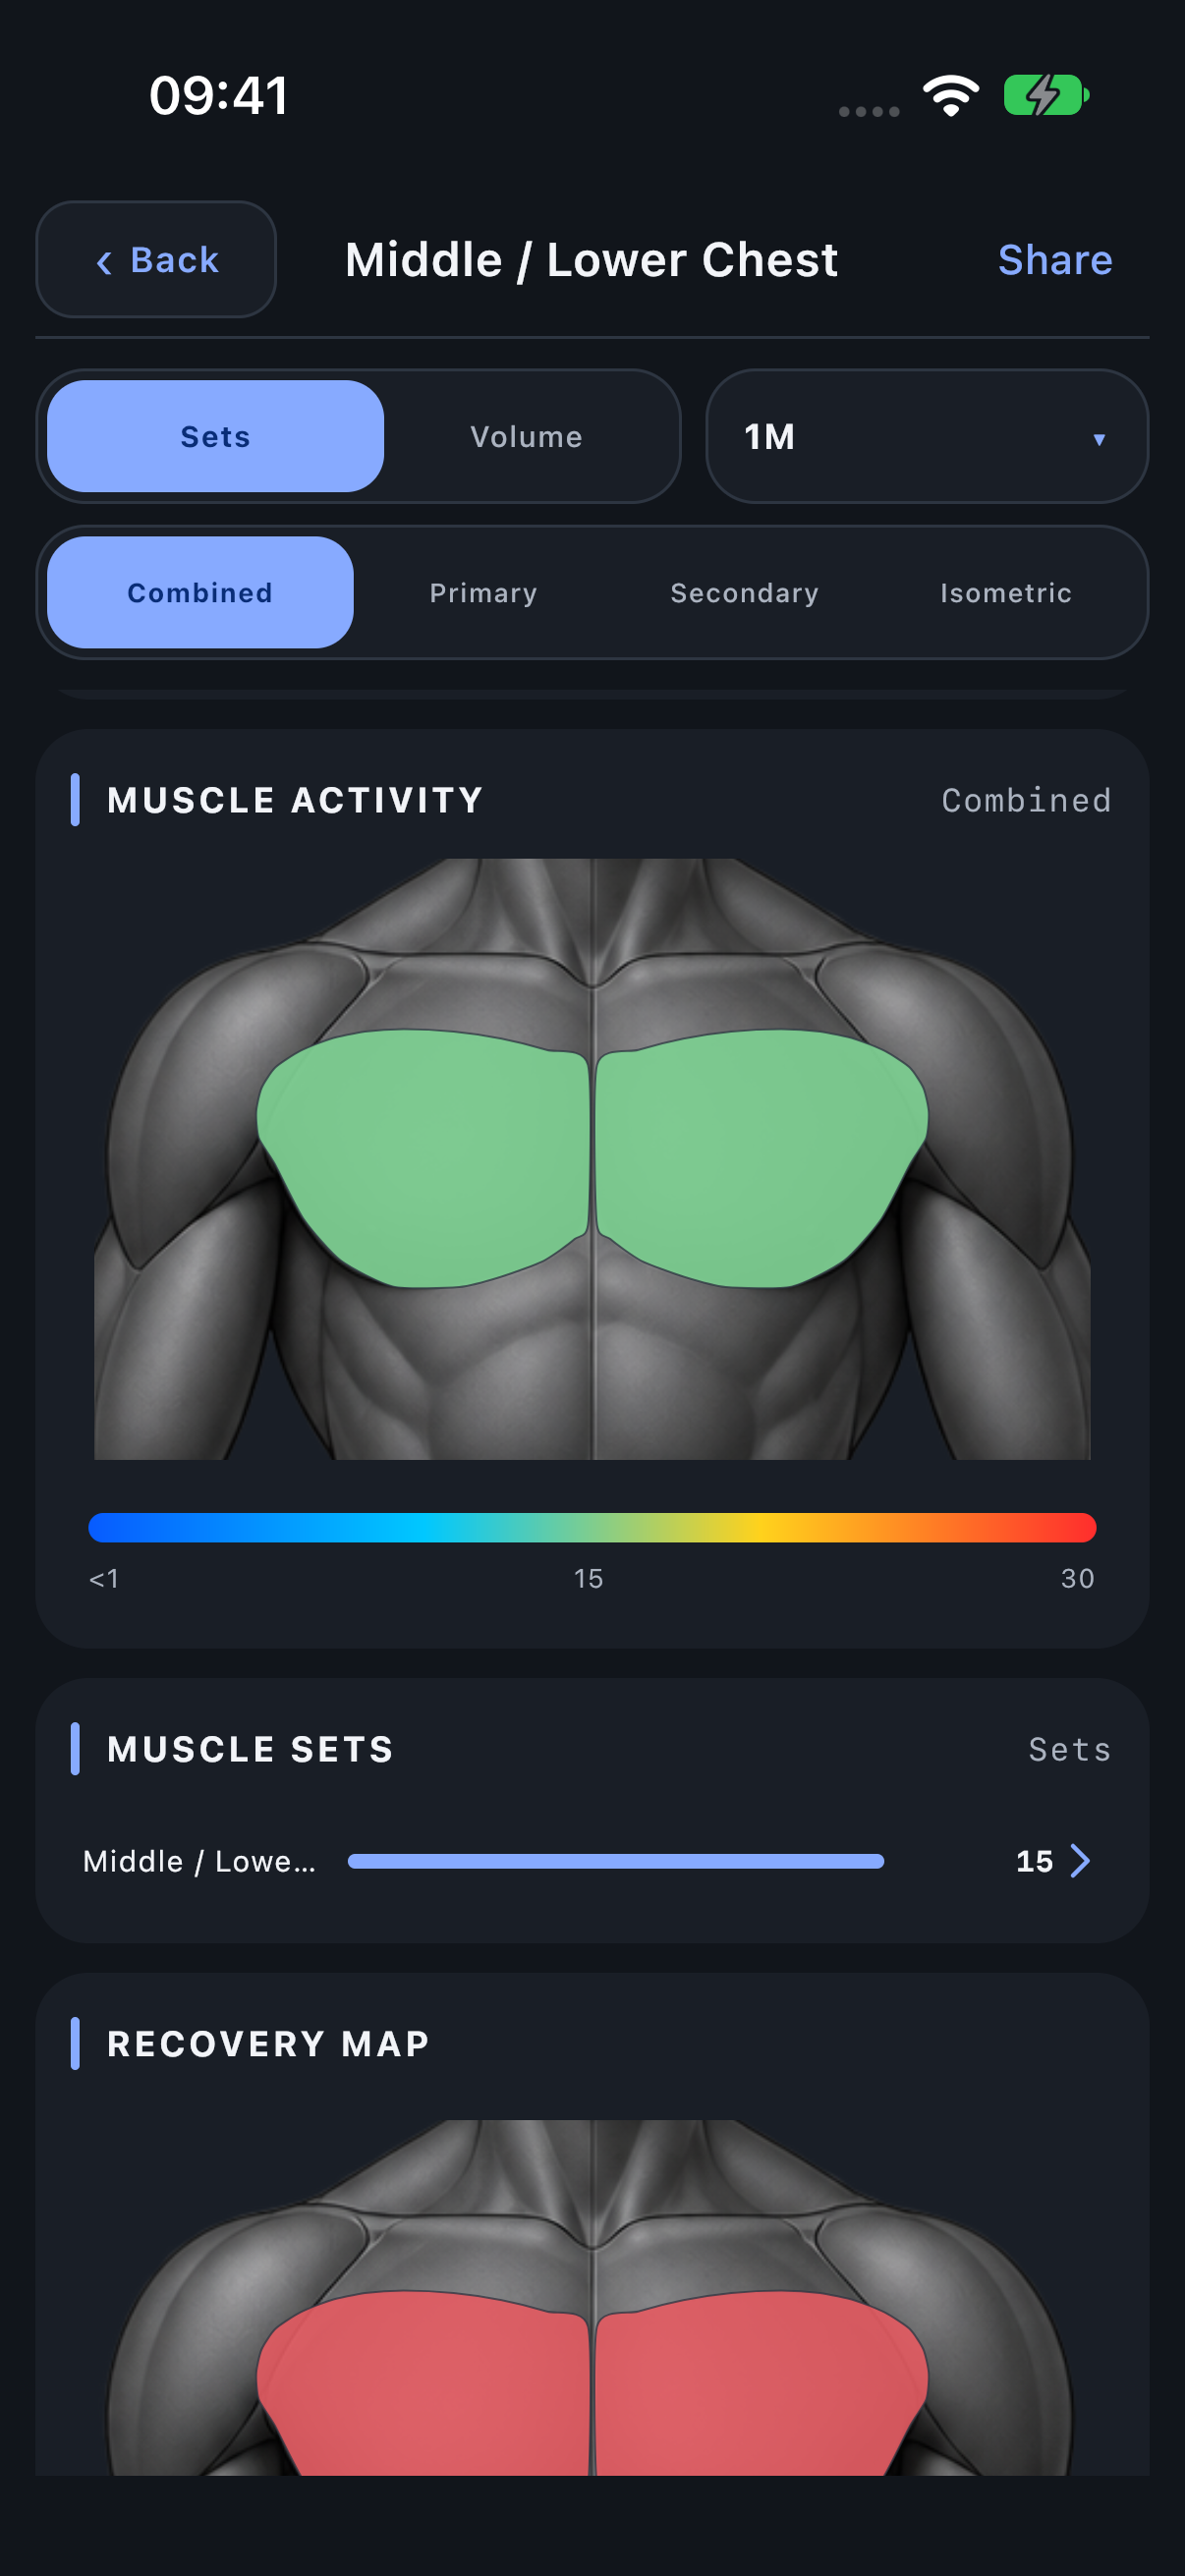
Open one muscle
From a group, tap a child row such as Middle / Lower Chest. The title identifies the single-muscle scope. Its figures, contributing Exercises and statistics now answer questions about that muscle. This is useful when the group total hides differences between its children.
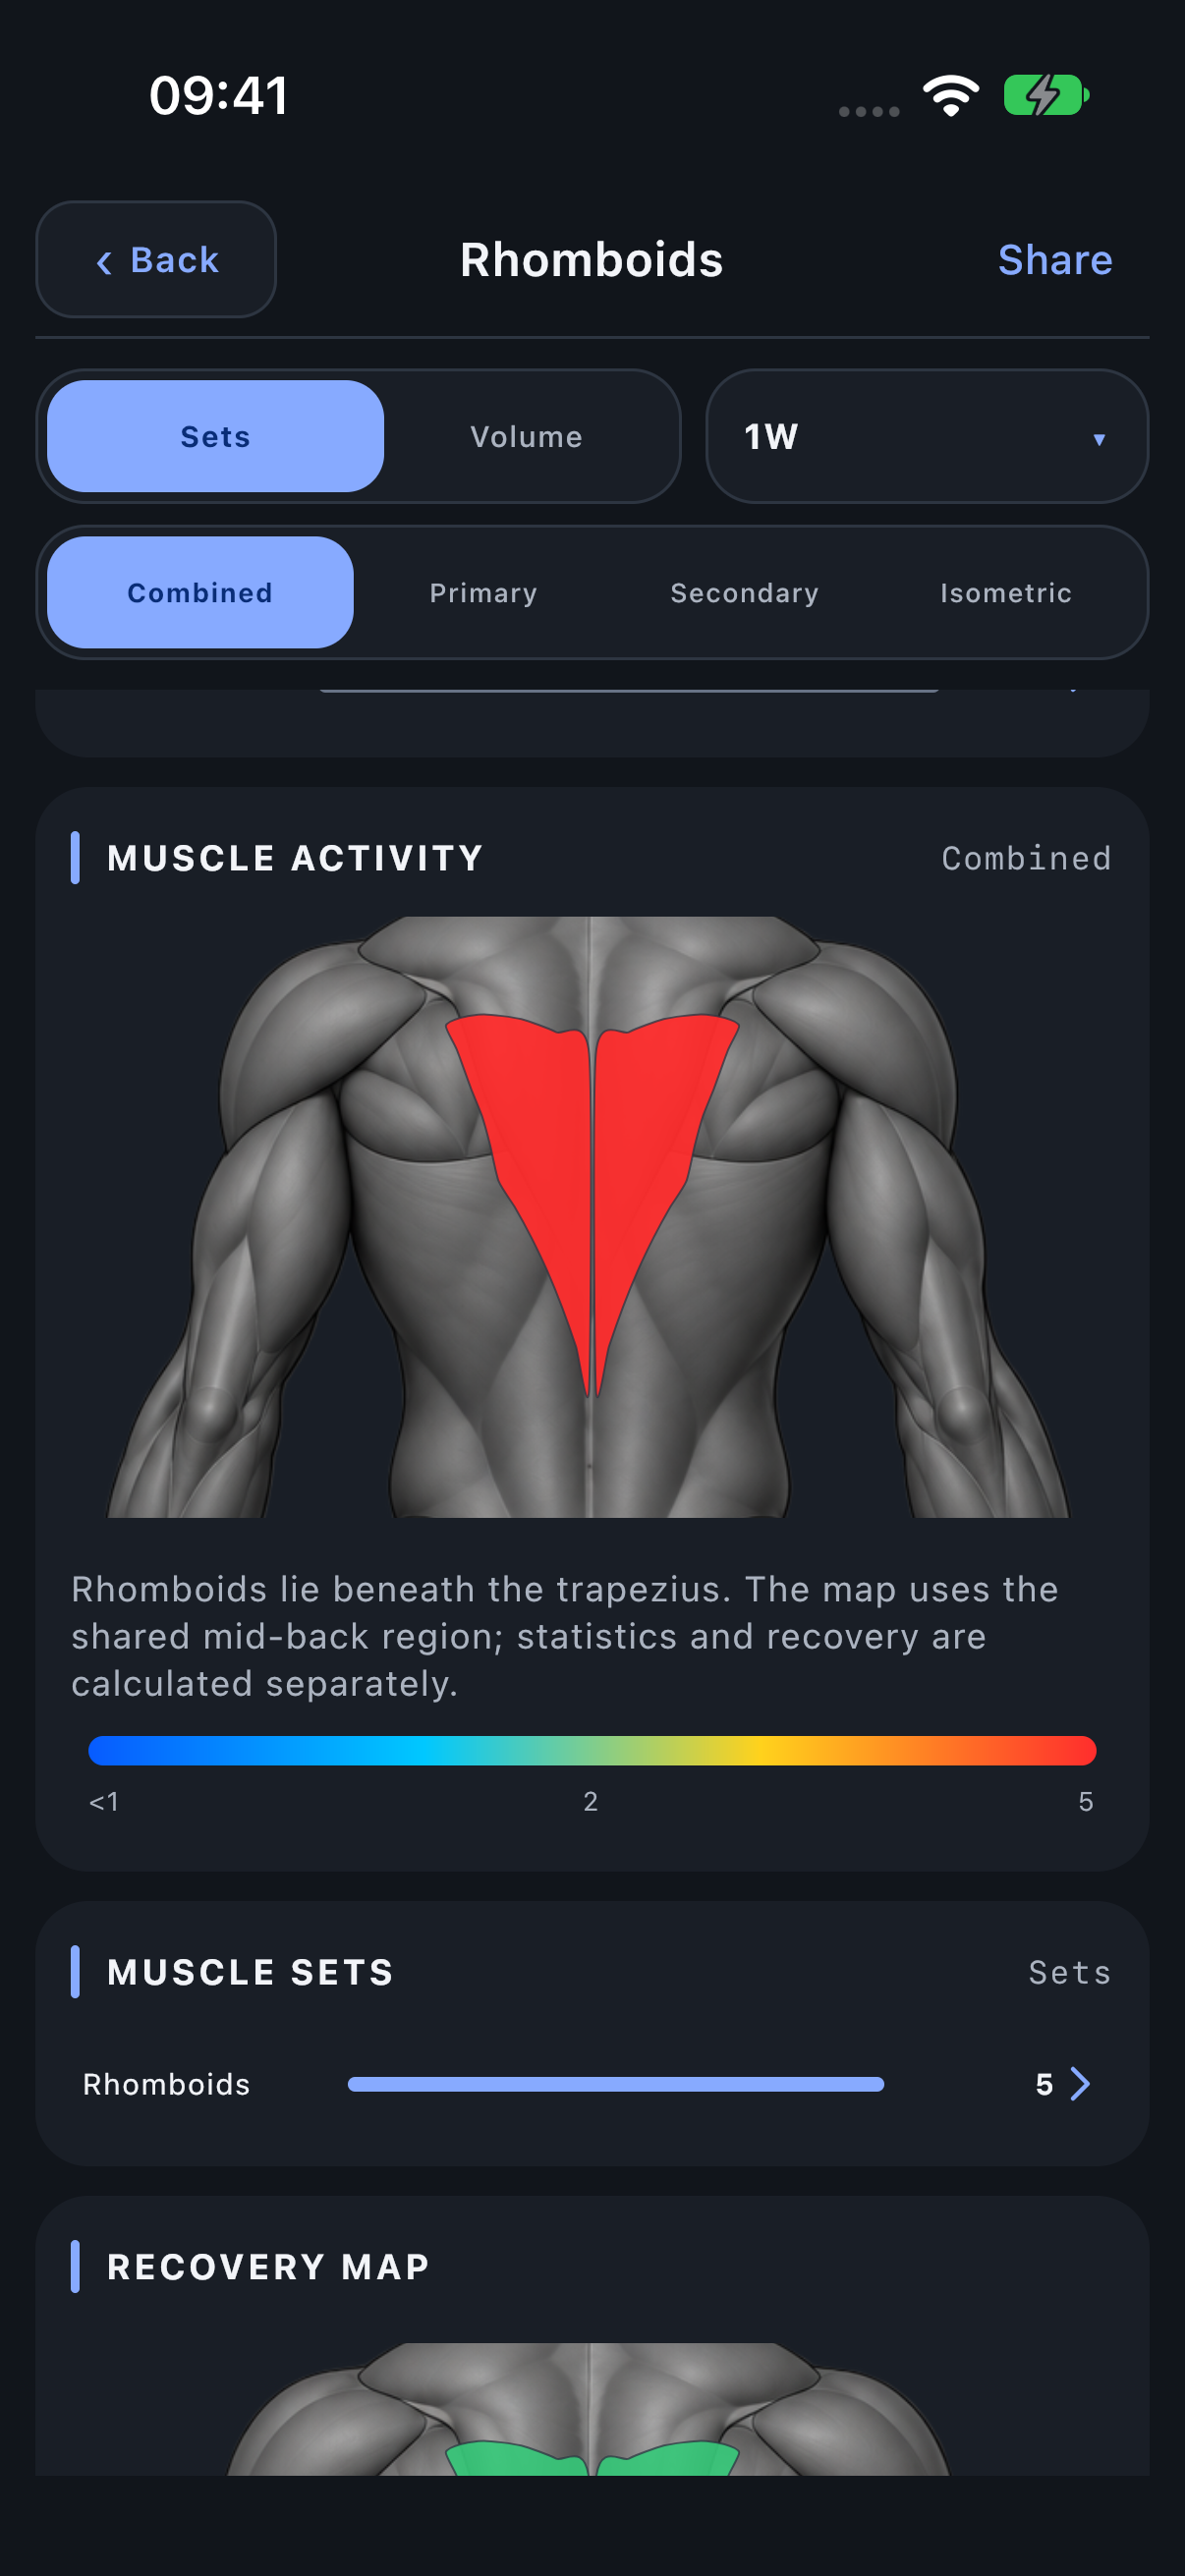
Understand shared and hidden regions
Serratus Anterior appears under Shoulders; Fibularis appears under Legs. The map includes the visible Teres Major area with Lats and Tensor Fasciae Latae with Abductors.
Rhomboids use the middle-back Trapezius area; Brachialis uses the Biceps area. These shared regions are a visual guide. Each muscle keeps its own set contributions and recovery estimate. Shared areas display the higher workload or lower readiness; values are not added together. A single-muscle view uses only the selected muscle’s values.
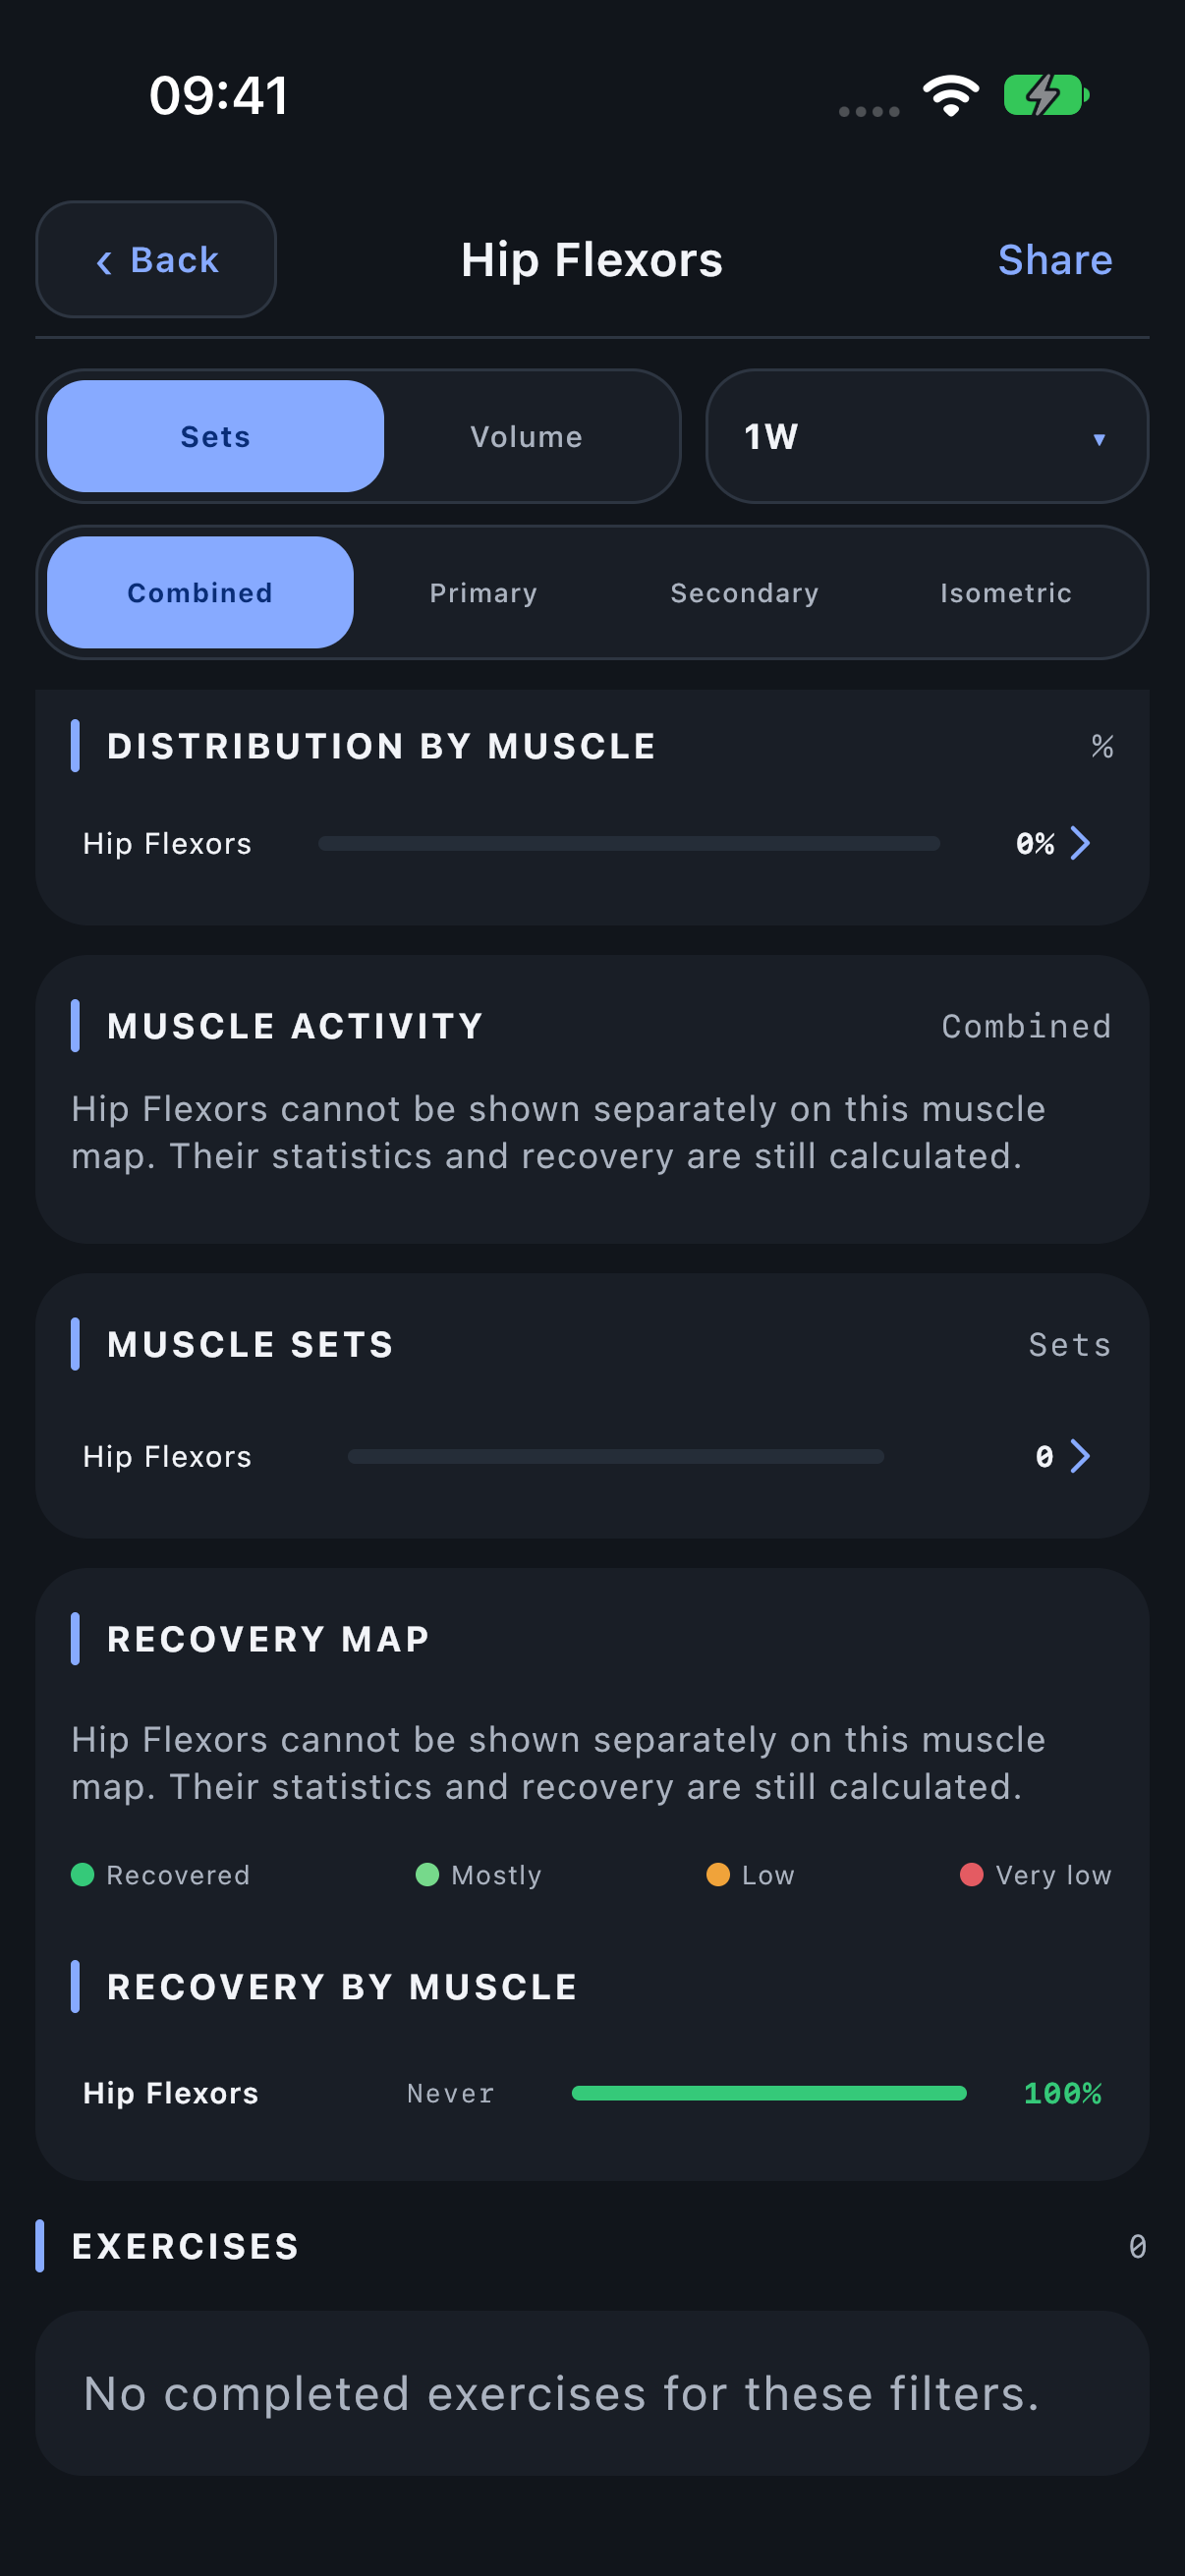
Hip Flexors cannot be shown separately on this map. Their numerical statistics and recovery remain available. The individual-muscle screen explains this limitation. A blank region does not necessarily mean that a muscle did no work.
When a muscle has no separate map region
Hip Flexors stay in numerical statistics, charts and recovery calculations. This map has no separate drawable region for them, so the screen explains the limitation and leaves the map unpainted. It does not substitute another muscle’s workload or remove recorded sets.
In this example the current filters contain no Hip Flexors work, so the rows show zero and Recovery says Never. With recorded work, those numerical results change even though the map limitation remains.
Distinguish workload from recovery
The blue-to-red Muscle activity figure describes work during a selected period. The green/orange/red Recovery map estimates recovery from recent Primary, Secondary and Isometric work. A heavily trained region can be red in activity and green in Recovery if that work happened long enough ago. Read the recovery calculation for its time model and limits.