 TrainNotes
Muscle distribution radar
How is your muscle contribution distributed, and has its share changed?
What it shows
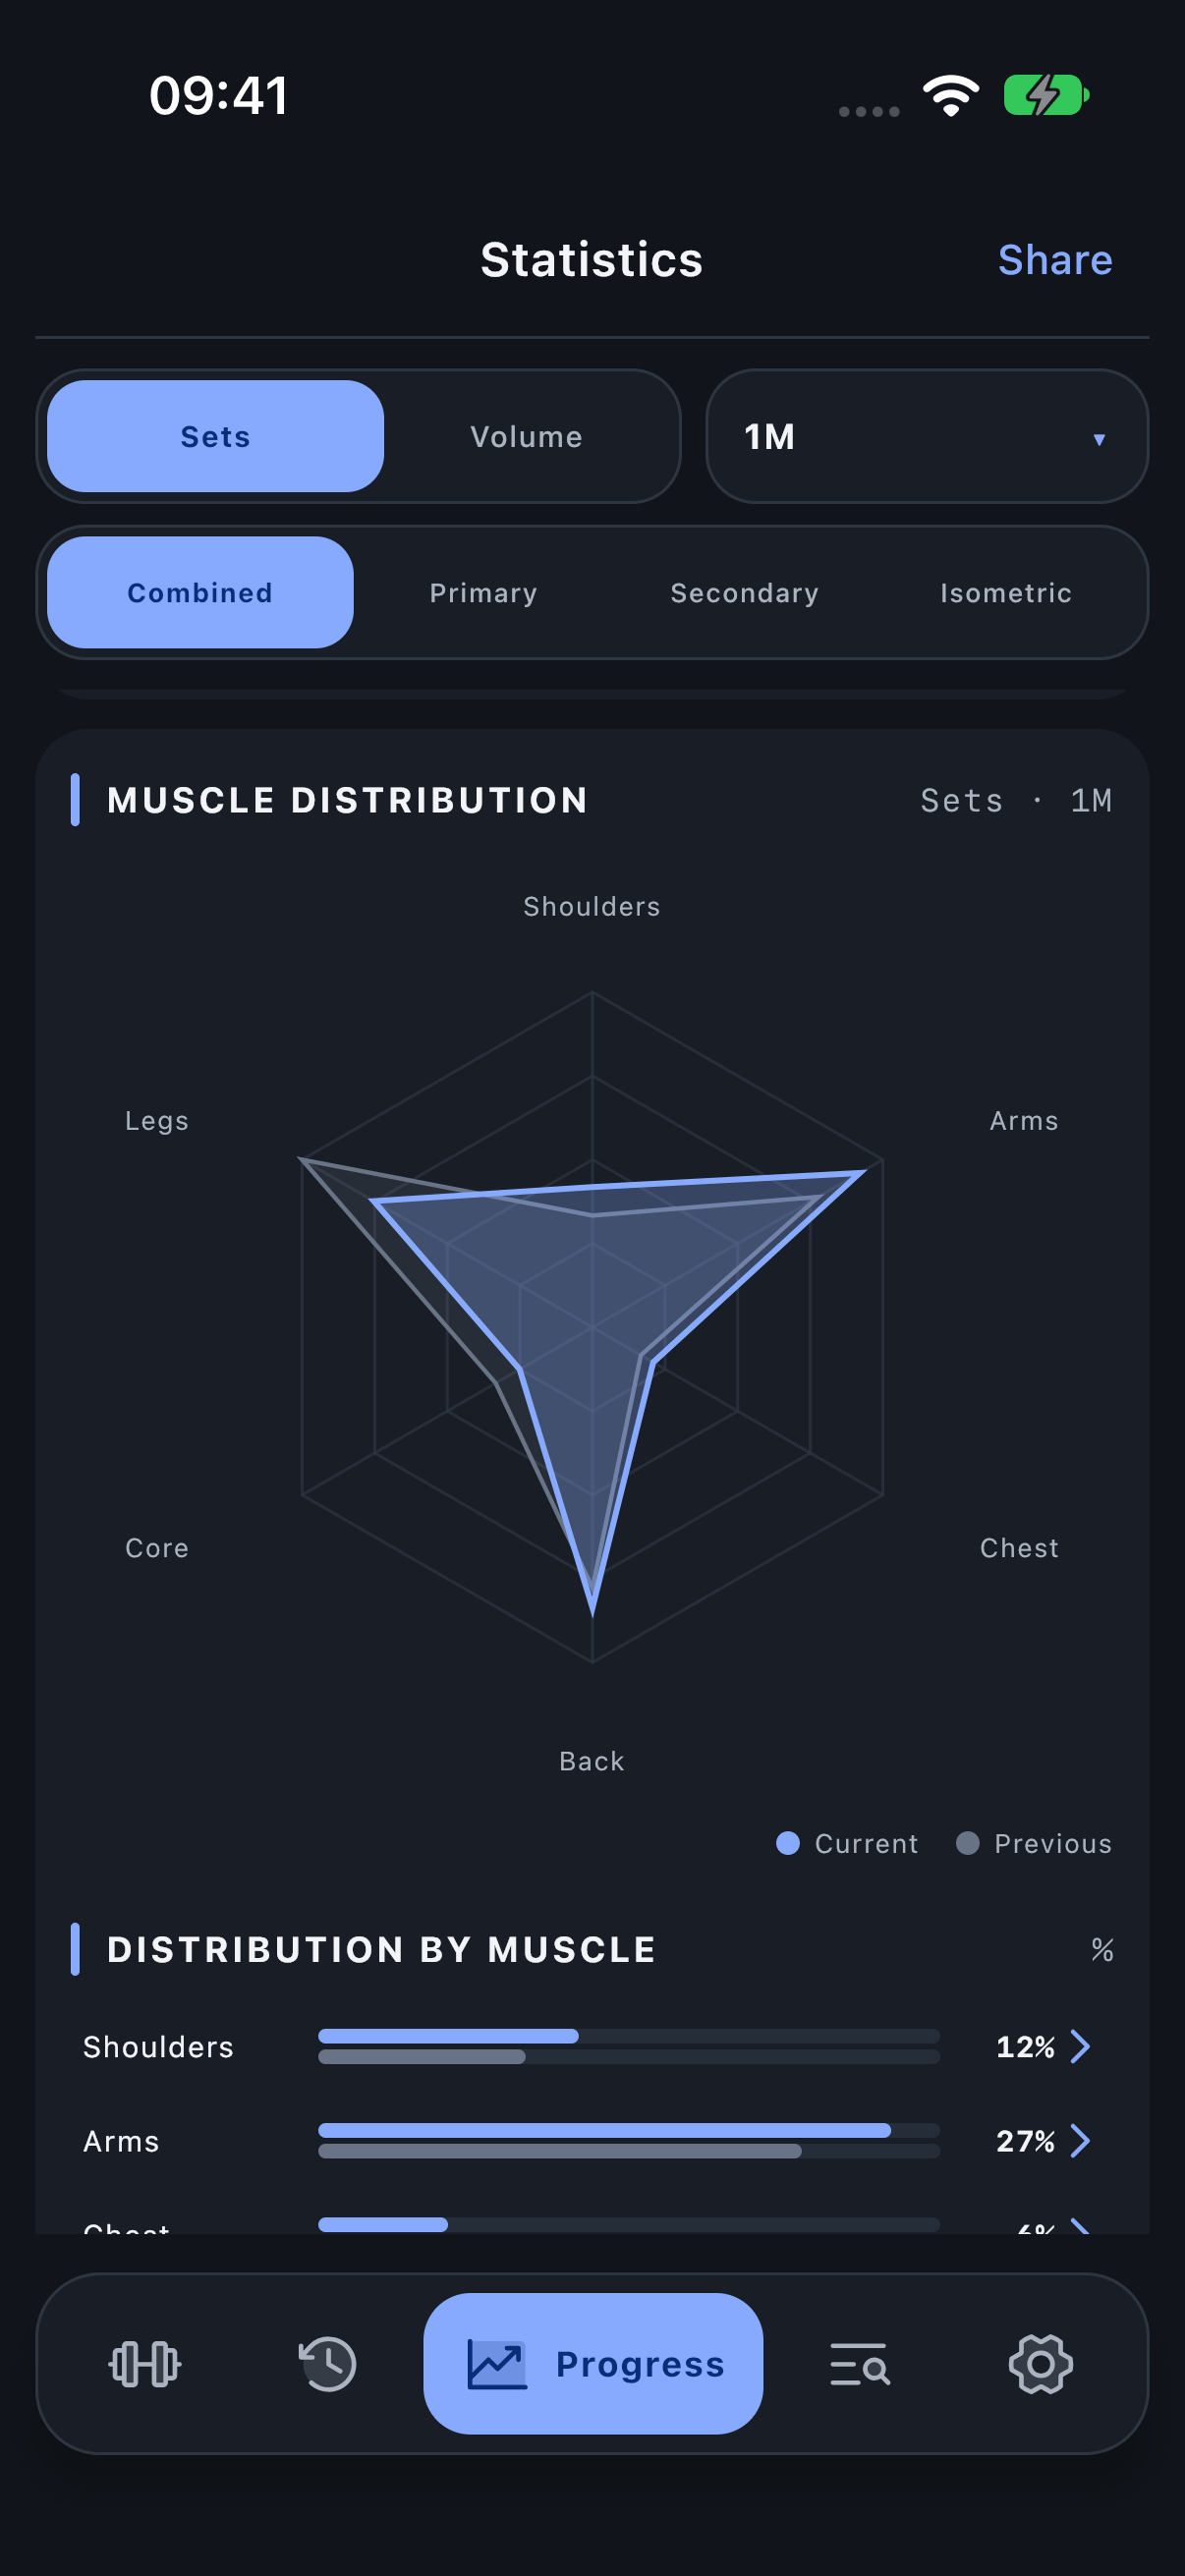
Each axis represents a displayed muscle group or muscle. The polygon describes its share of total contribution within that scope. Current is the selected period; Previous is the preceding equal-length period when it has data.
How to read it
Read the legend, then compare the two outlines on the same axis. A larger share can result from more work for that muscle or less work elsewhere. The shape is not a strength score, and a regular polygon is not a prescribed programme.
In the pictured example Arms has a larger current share than before. That alone cannot establish whether absolute arm work rose: check the numeric contribution rows as well. The neighbouring percentage table gives exact rounded shares.
Period, units and filters
Sets/Volume and the involvement role affect the contributions. Inside a group the comparison is among its child muscles; inside a single muscle the scope is narrower still. The radial scale is fitted to the displayed shares, not a universal 100% target on every axis.
Investigate the result
Tap a navigable muscle label or percentage row to investigate its group. Use Muscle sets/volume to answer the separate absolute-load question.
Open Progress → Statistics and scroll to the named module.