 TrainNotes
Prepare a measurement share card
Choose a layout that matches what you want to show: photos, a body overview, a few numbers, one focus measurement, a comparison table or a weight/body-fat timeline.
Choose the dates, format and values
- Open Body measurements and tap Share.
- Choose the card template.
- Select From and To dates using the searchable date menu, grouped by month and year.
- Choose 1:1 or 9:16. These formats belong to measurement cards; statistics export uses its own automatic pages.
- Select the supported metrics and inspect the preview before sharing.
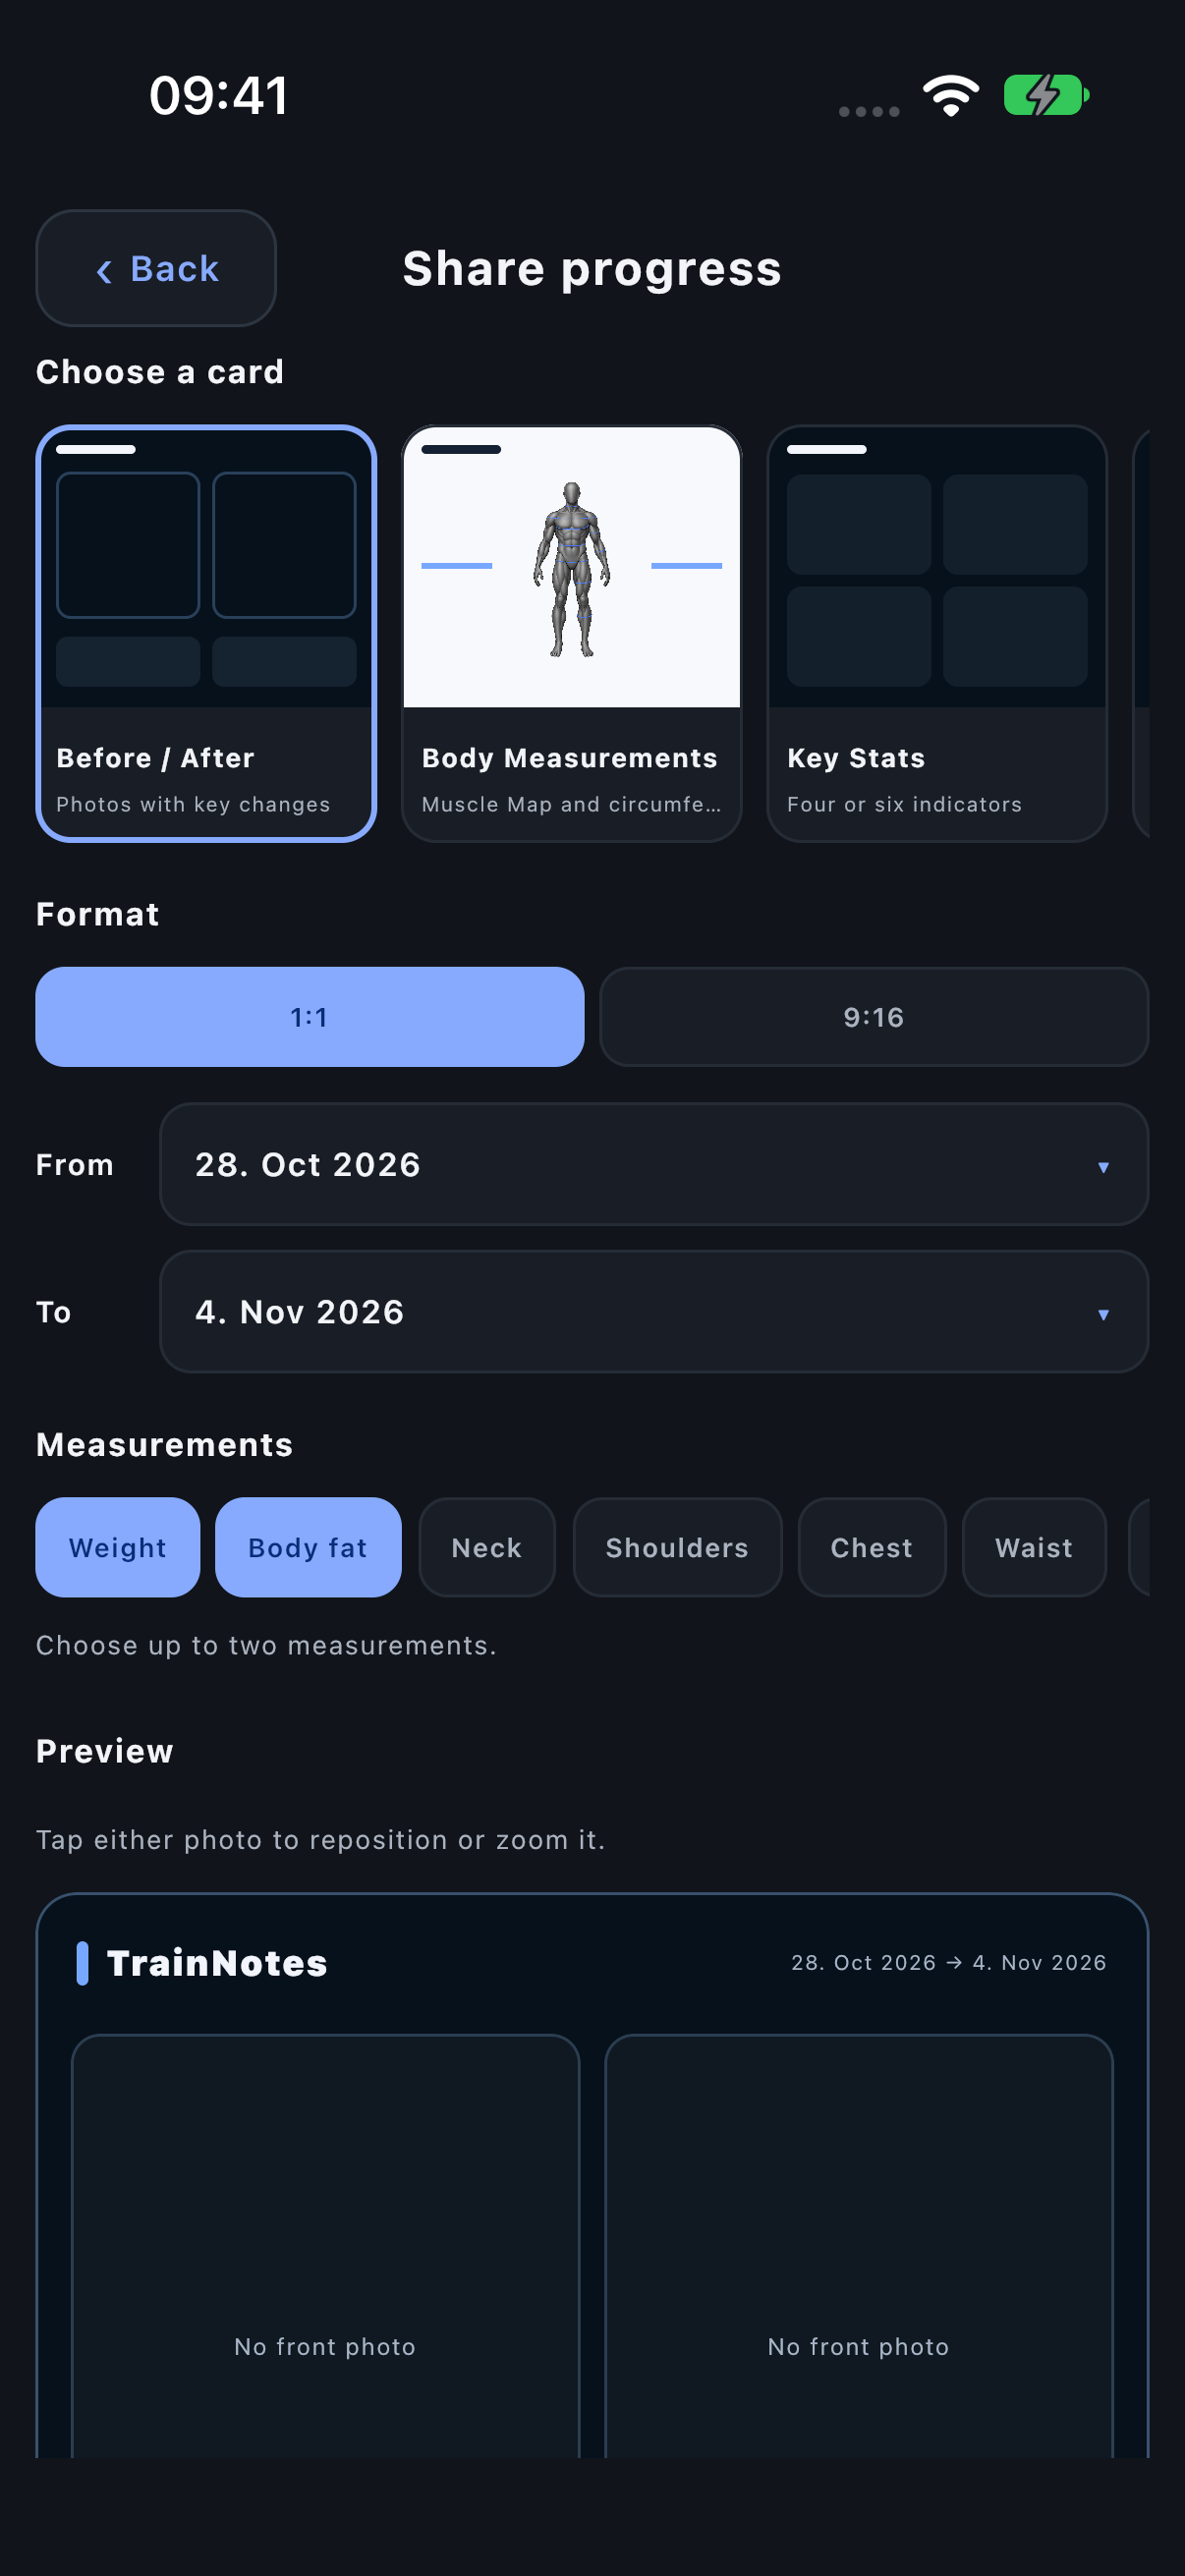
Before / After
Use the photo comparison when both selected entries have suitable progress photos. Tap each photo to adjust its visible position and zoom independently. The crop should show the same region of the body on both dates. Key changes accompany the photos; select only metrics you want a recipient to see.
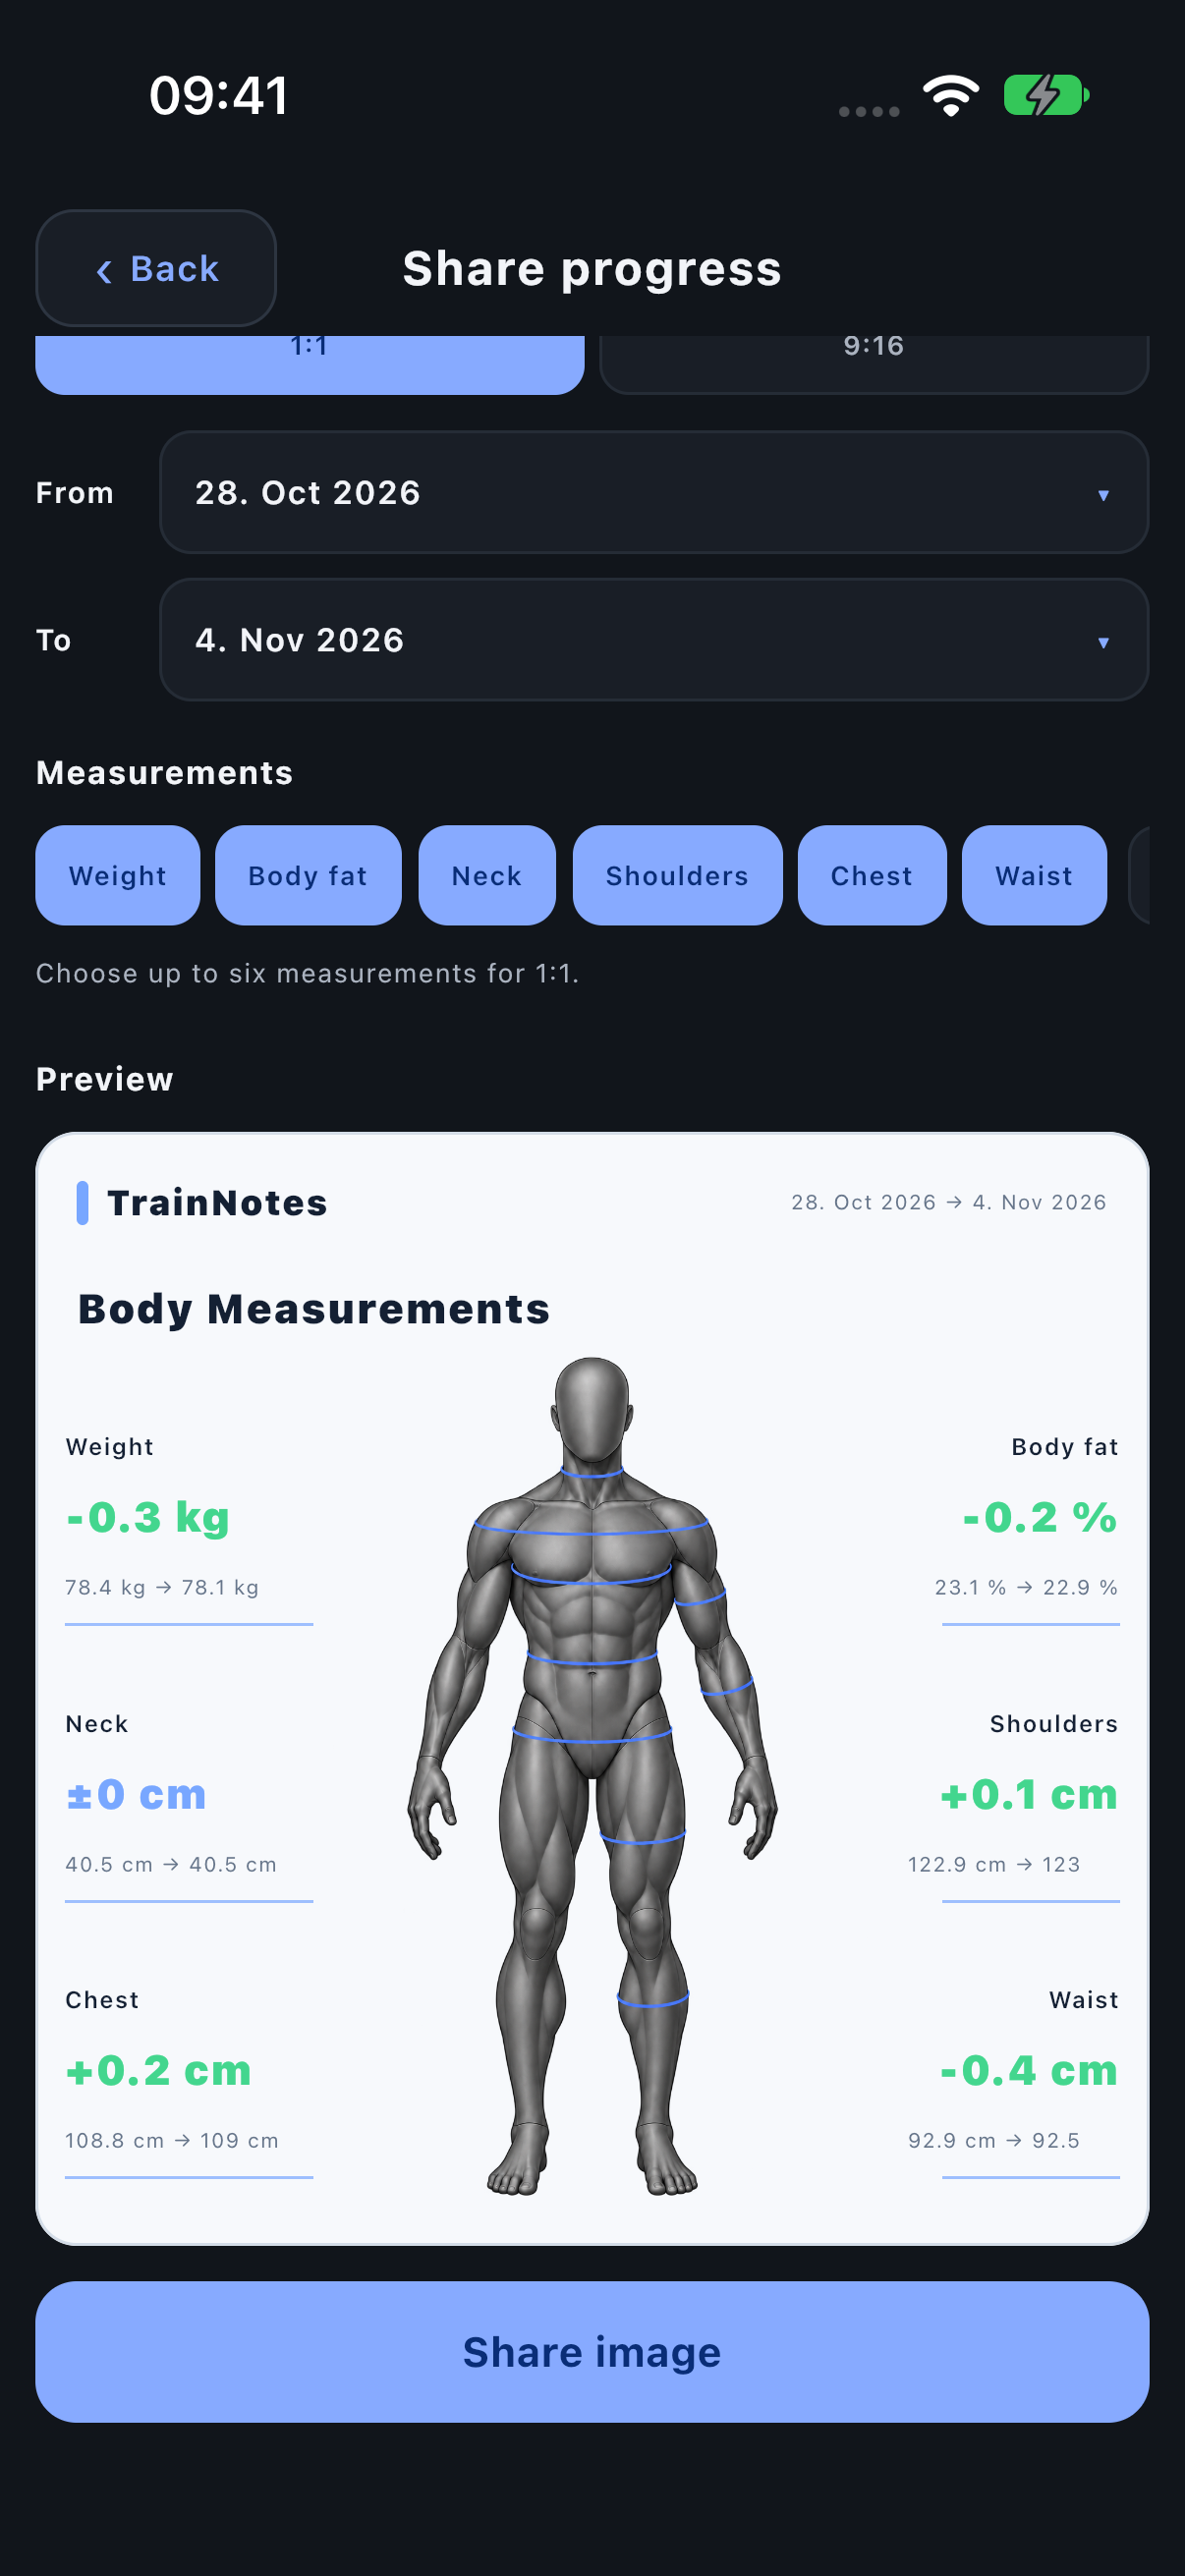
Body Measurements
Use the mannequin layout to place circumference changes around the body. Select the measurements you want included and keep within the format’s supported capacity. Read each label’s before/after values and change; the body figure is a visual locator.
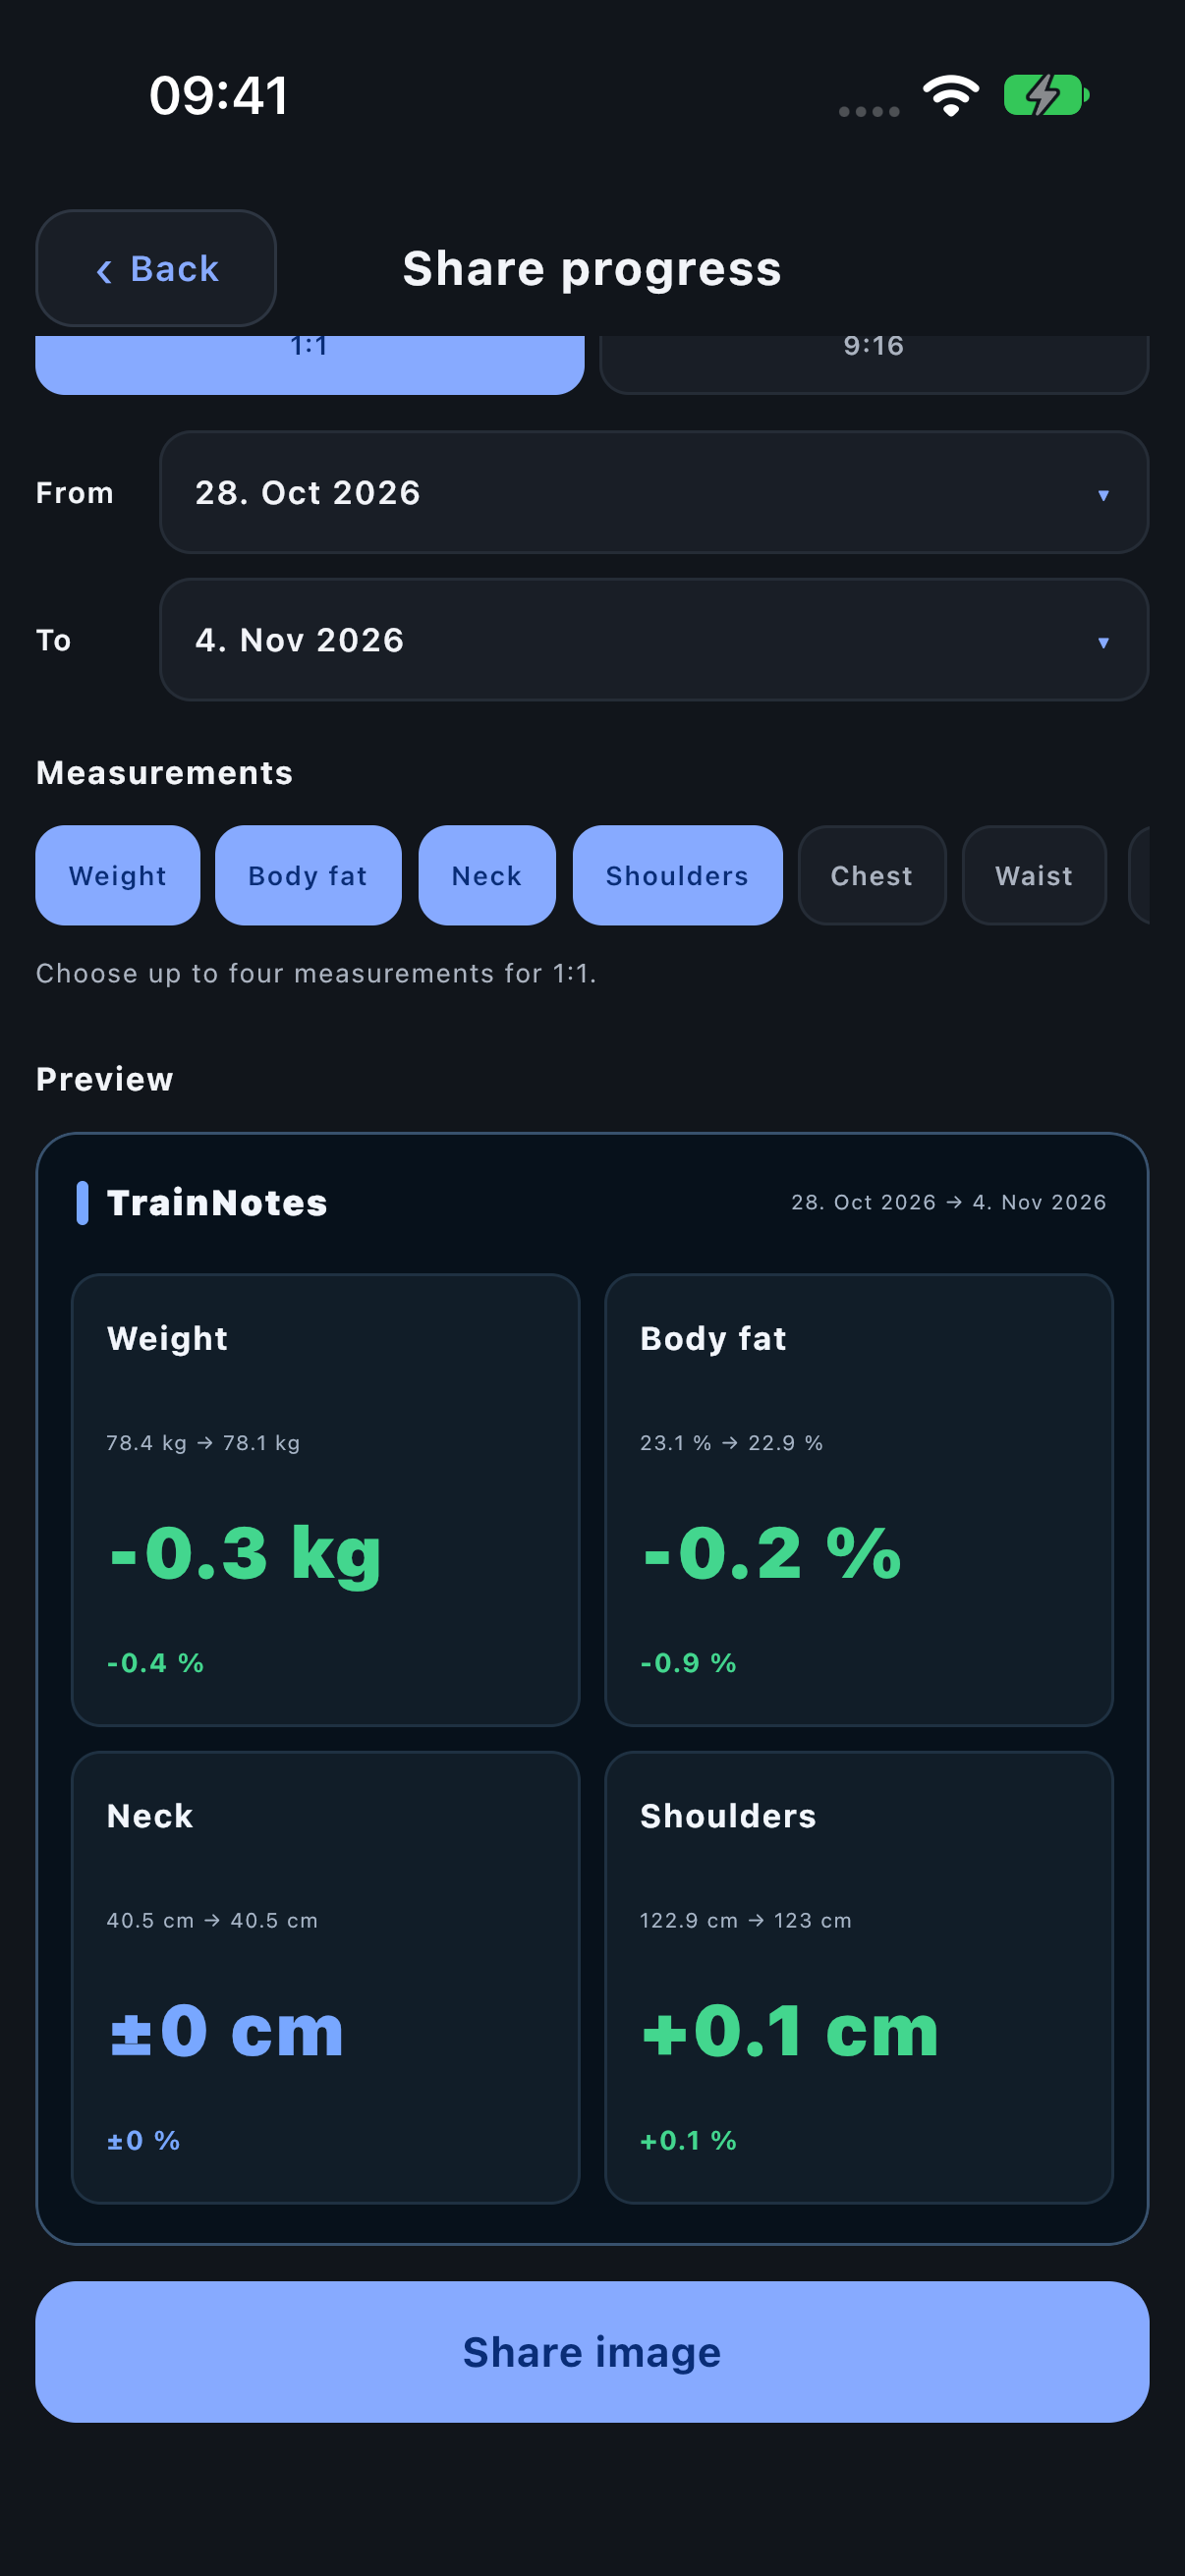
Key Stats
Use Key Stats for a small collection of prominent values. The square format supports four indicators and portrait supports six. It suits a concise comparison when the body diagram or photos would add little context.
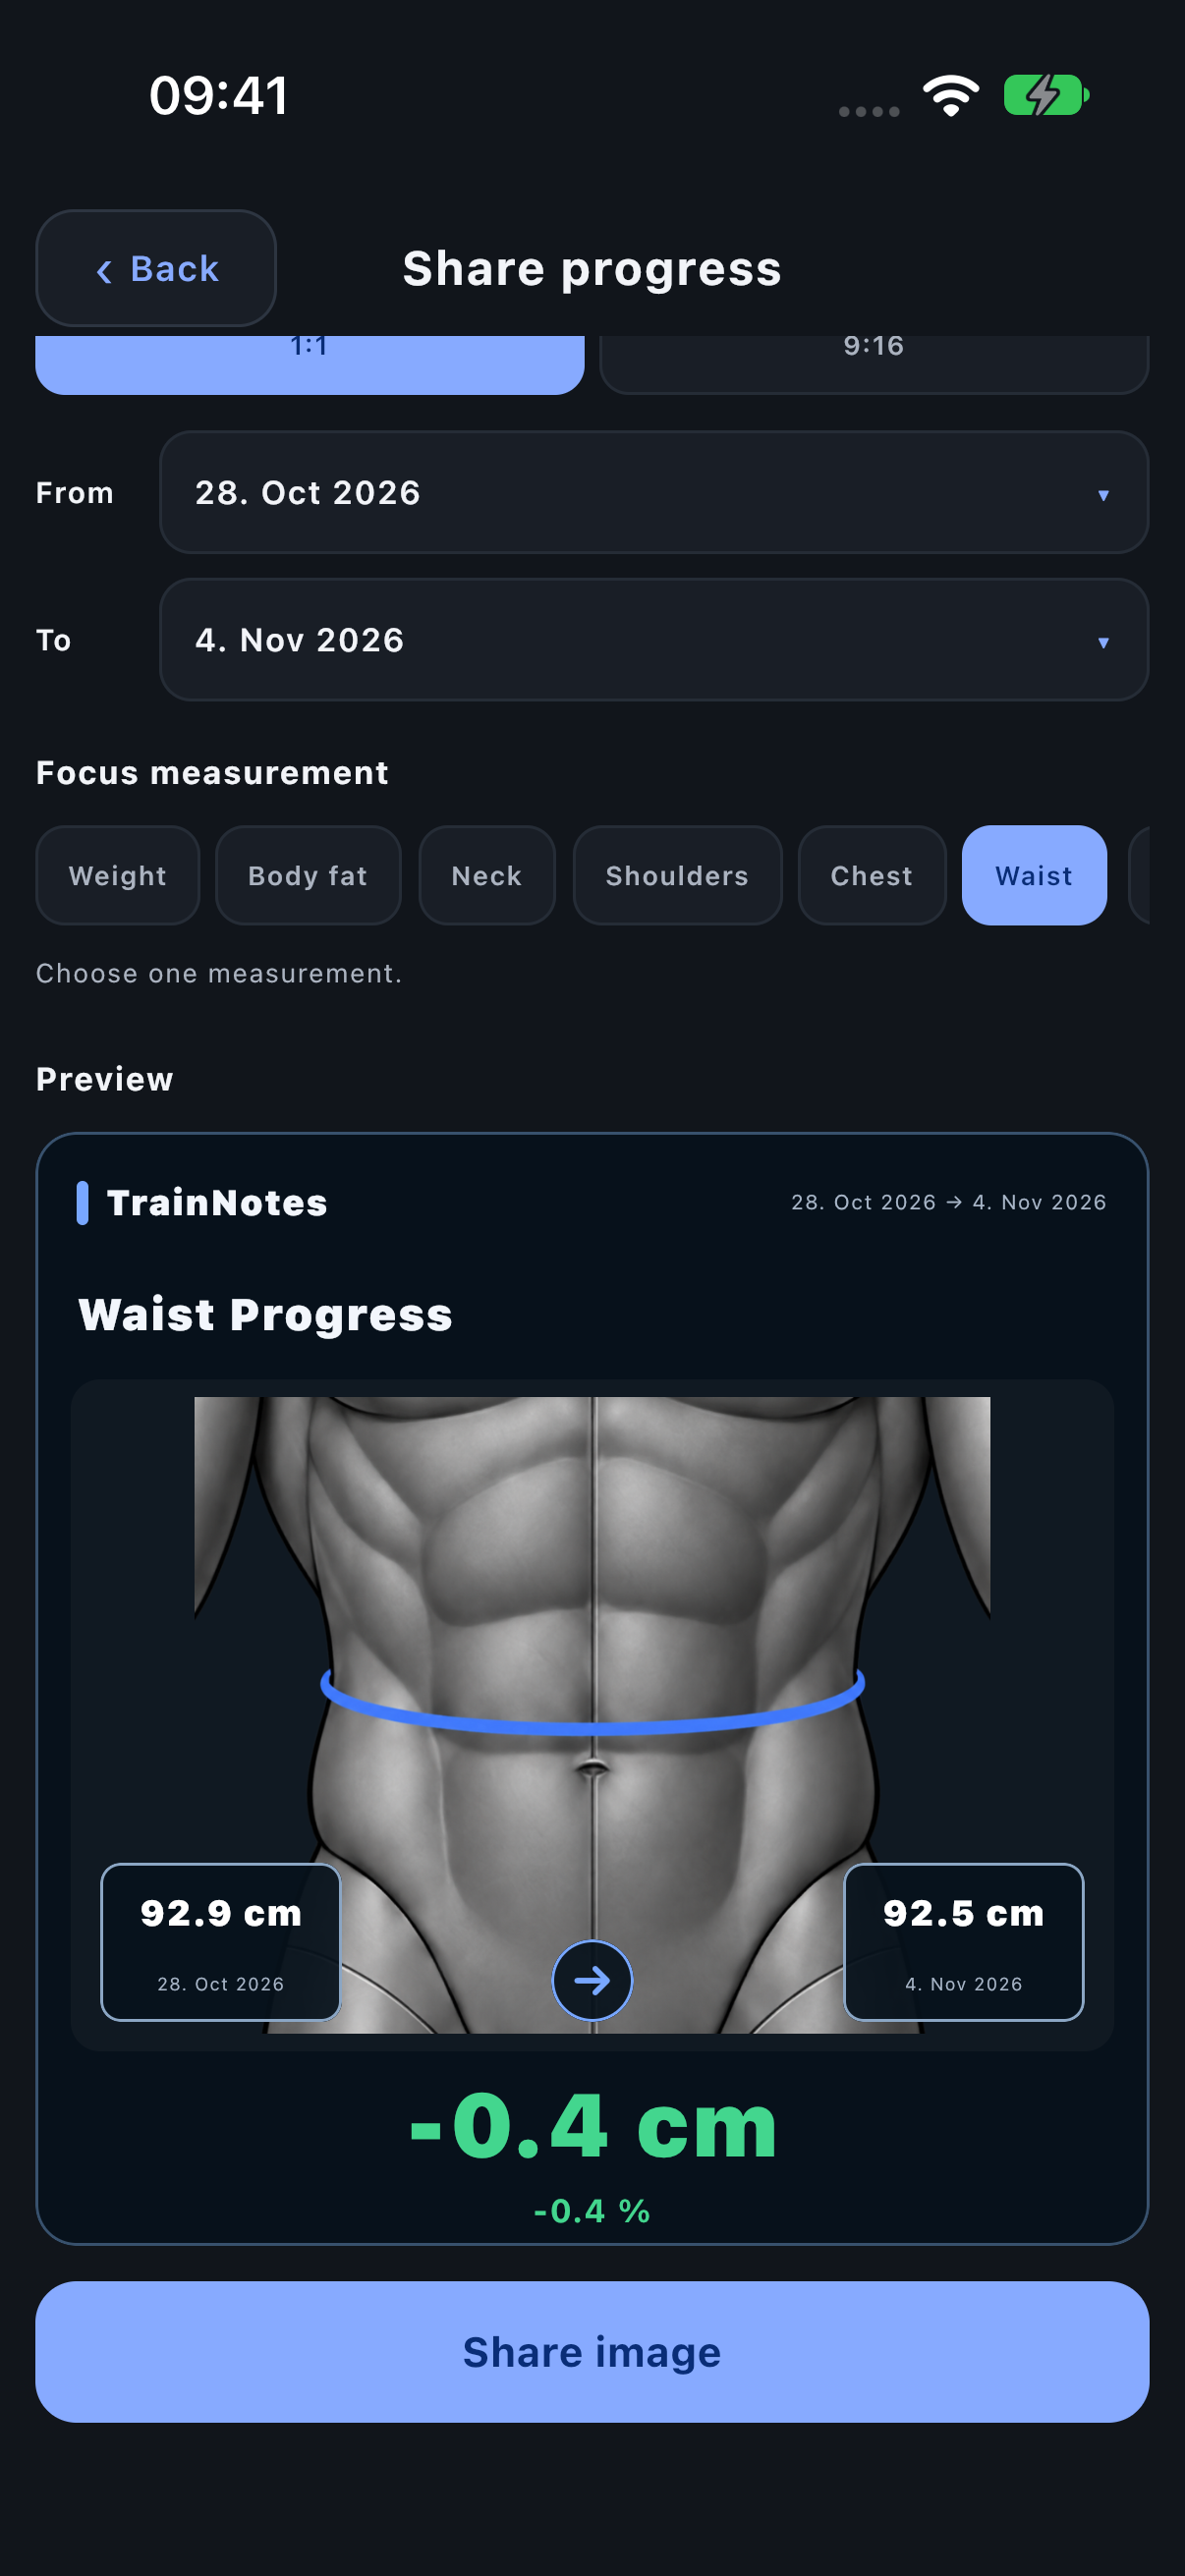
Focus Area
Choose one measurement to explain in detail. The illustration follows the selected measurement region. Check that both dates contain a comparable value for the same metric and side.
List Comparison
Use the table when the recipient should see several measurements side by side. Read its two date columns before the Change column. The unit belongs to the measurement, so a percentage-point body-fat change should not be mistaken for kg or cm.
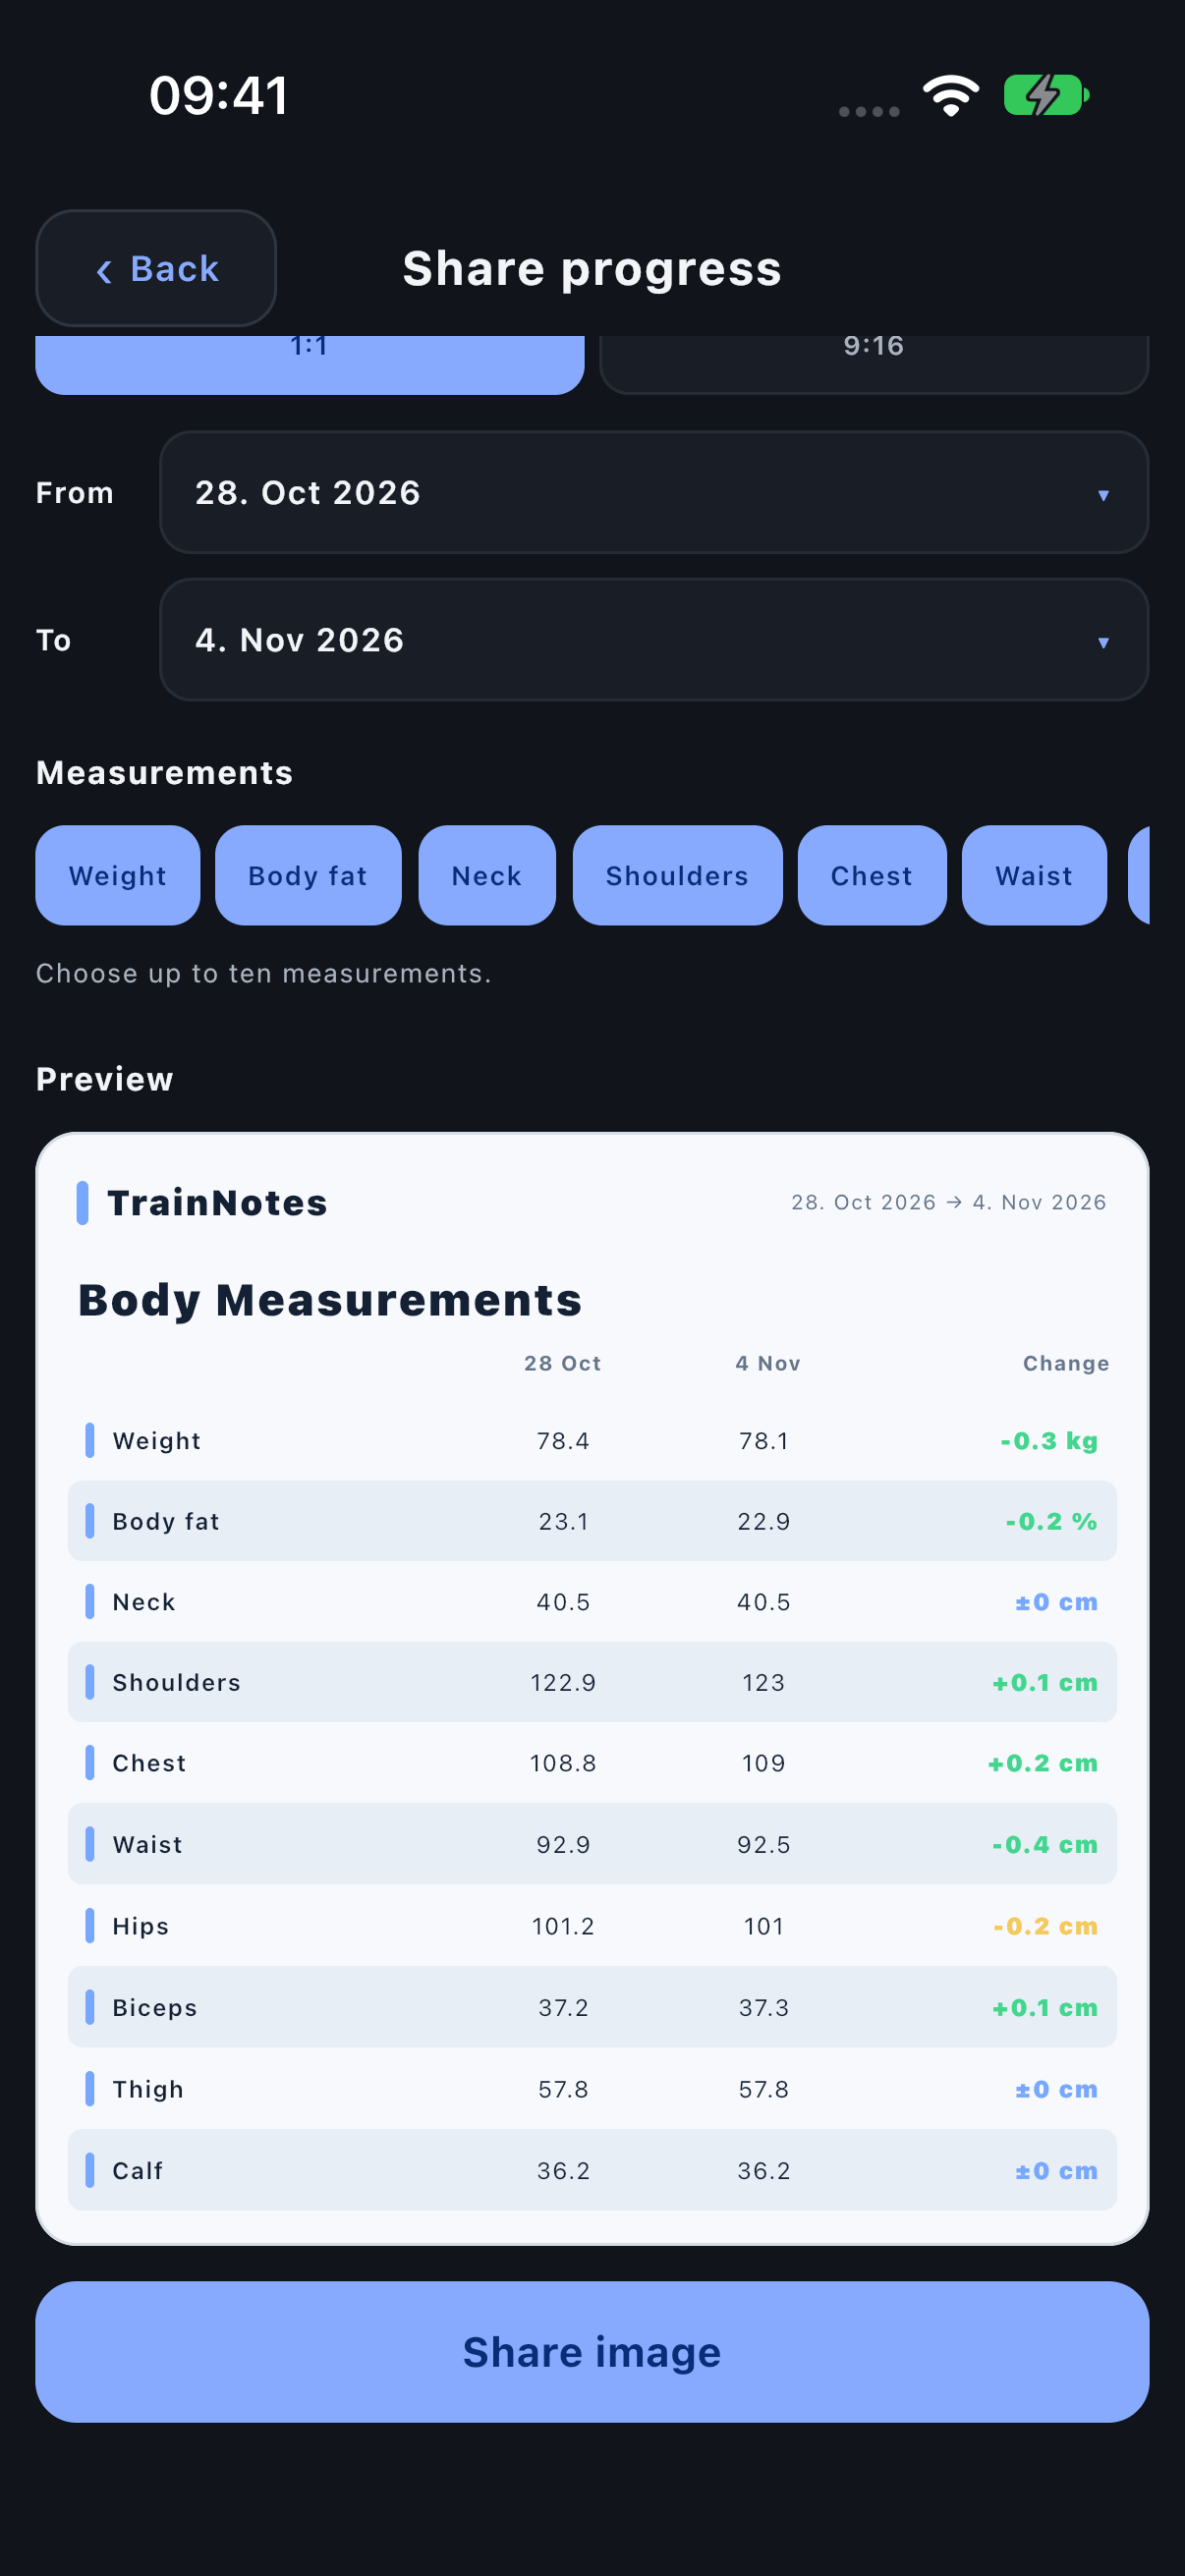
Progress Timeline
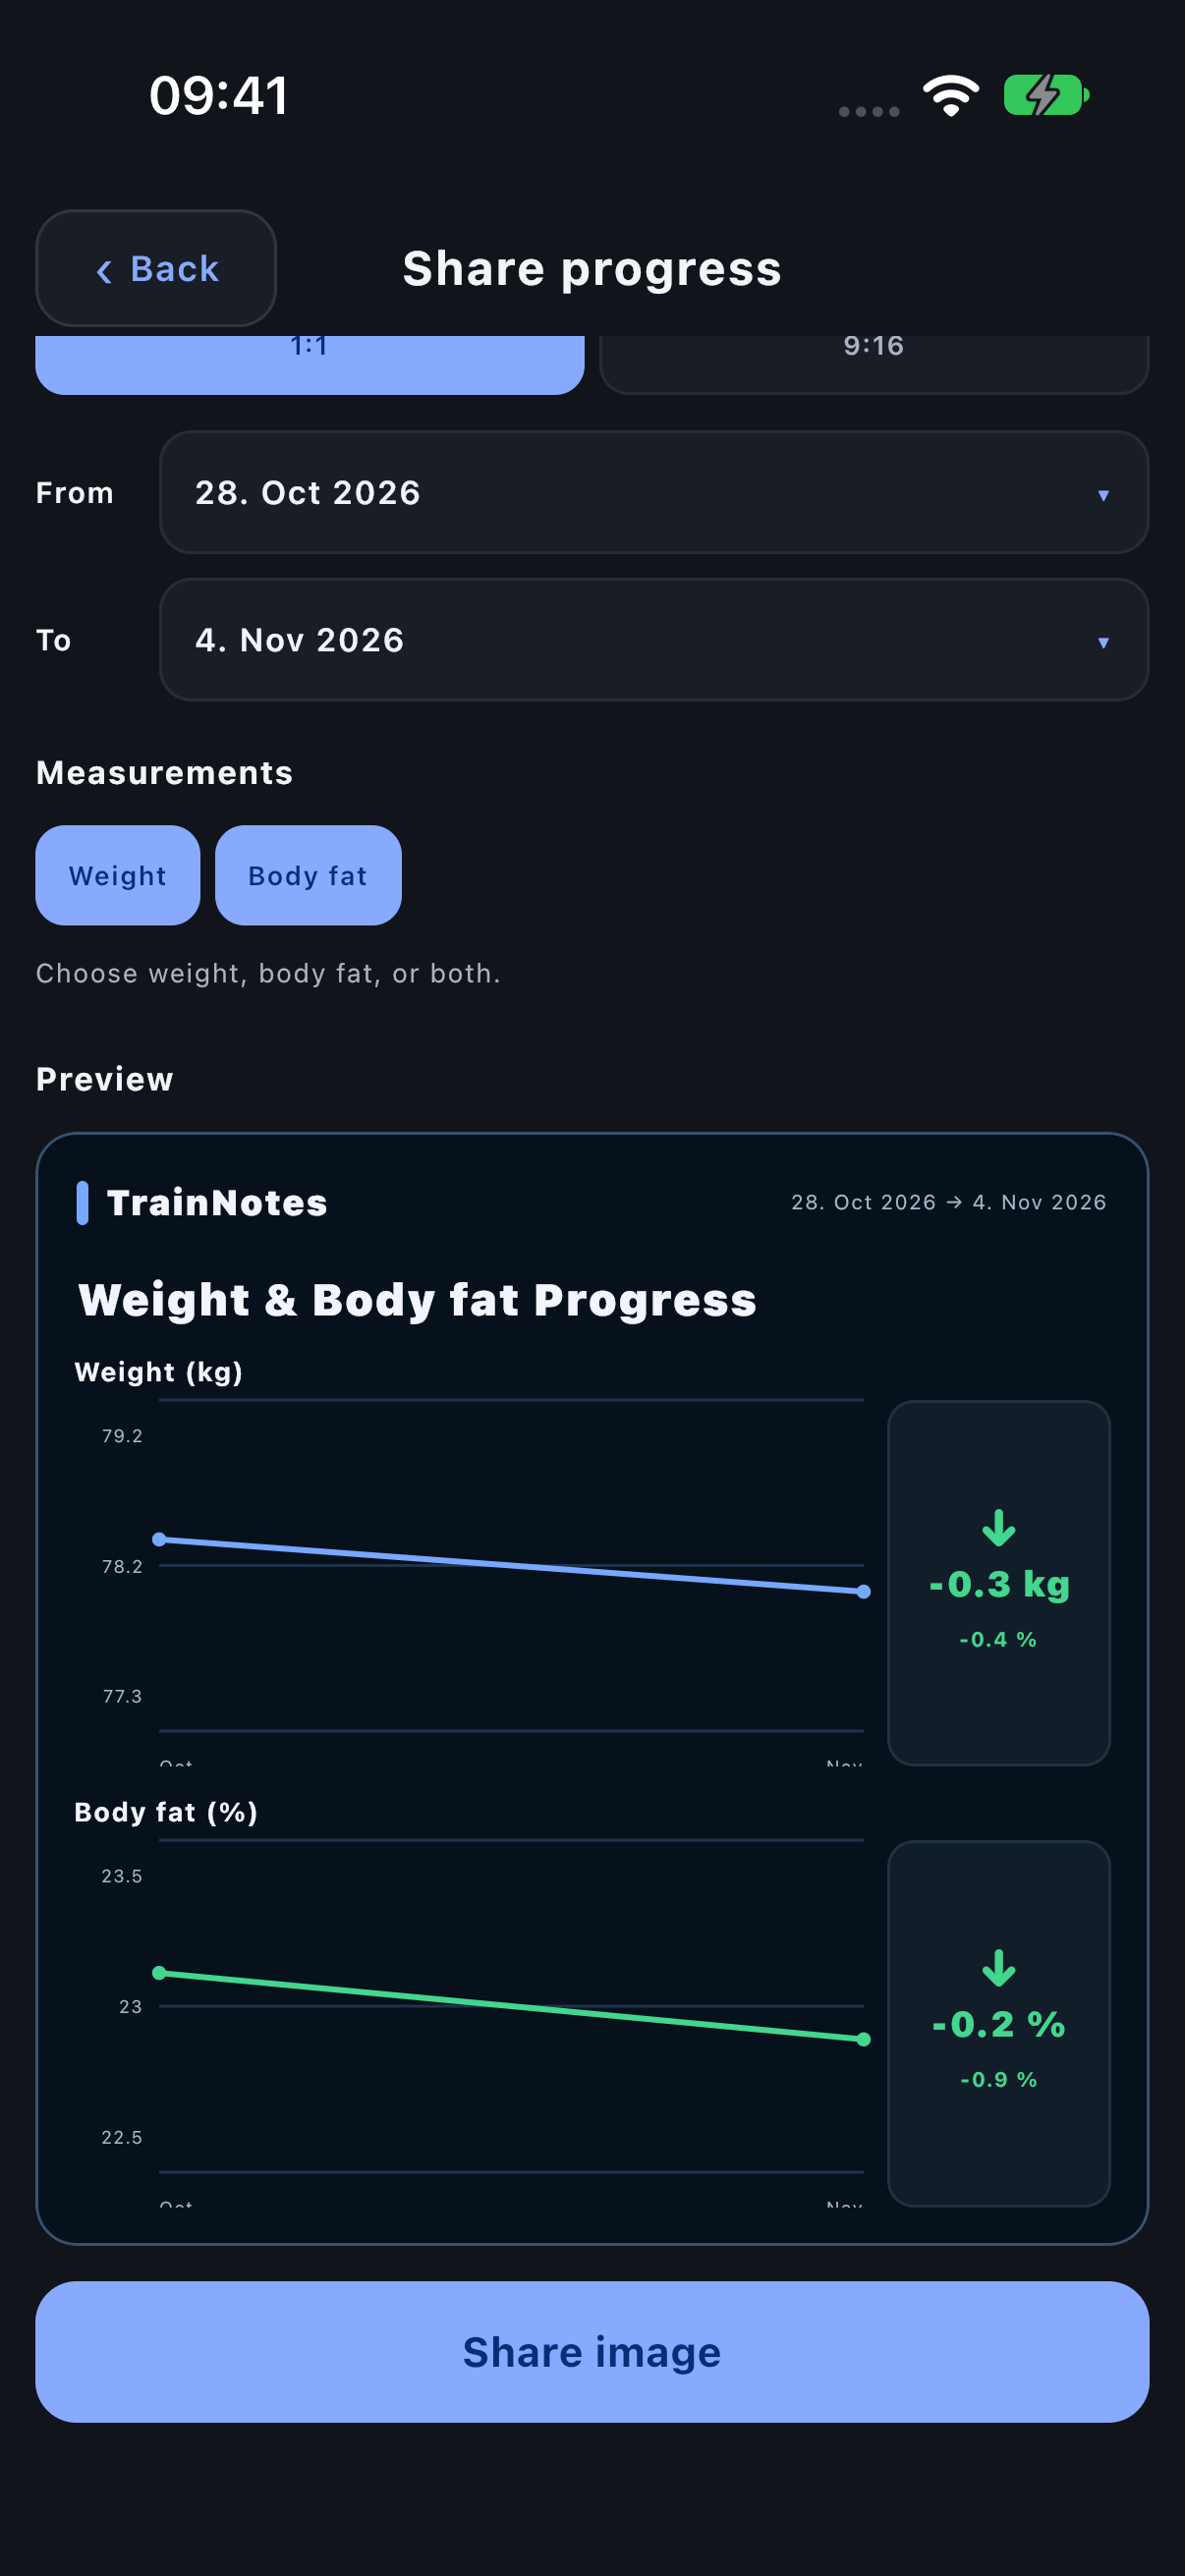
Use the timeline to show weight and body fat across the selected interval, rather than only the difference between two endpoints. Intermediate entries explain whether a net change was gradual or variable. Missing measures do not become zero values.
Review the exported content
Inspect the actual preview for dates, selected metrics and photo framing. The image is shared through iOS to the destination you choose. The short TrainNotes caption is a separate share-sheet text item; editing or omitting it depends on that destination app. Sharing does not create a public online measurement profile.